
| Statistic | Value |
|---|---|
| n (movies) | 5377.0 |
| Mean | 99.3 |
| Median | 98.0 |
| Std. Deviation | 28.5 |
| IQR | 28.0 |
| Minimum | 3.0 |
| Maximum | 312.0 |
HW2:
From Data Exploration to Probability
🎬 The Case
Welcome back, Statistical Detective!
Your success with Brew Haven has caught the attention of StreamFlix, a growing streaming service competing with Netflix and Disney+. The VP of User Experience, Jordan Chen, has reached out with an urgent problem:
“We’re losing subscribers at an alarming rate, but we don’t understand the patterns. Some users cancel after trying our free trial, others leave after a few months. We track viewing habits, subscription tiers, and device usage, but we need someone who understands probability to help us predict churn risk and identify our most valuable customer segments. Can you help us make sense of these patterns?”
Jordan has provided real data from the industry alongside StreamFlix’s own subscriber records. Your job starts the way any good statistical investigation does: exploring the data before making probability-based claims.
Your mission: First, use exploratory data analysis to describe what the data looks like. Then, use probability concepts to help StreamFlix understand their subscriber patterns and reduce churn!
Part I: Exploratory Data Analysis
Question 1: What Does Streaming Content Look Like?
Before analyzing StreamFlix’s subscribers, Jordan wants you to understand the broader streaming landscape using publicly available data. This question uses the Netflix Titles dataset, collected and shared through the TidyTuesday project. It contains information on Netflix titles added between 2008 and 2021. The variable of interest is duration_min, which records the runtime of each movie in minutes for all movies in the catalog.
The summary statistics and visualizations below have been generated for you. Use them to answer the questions that follow.
a. Summary Statistics
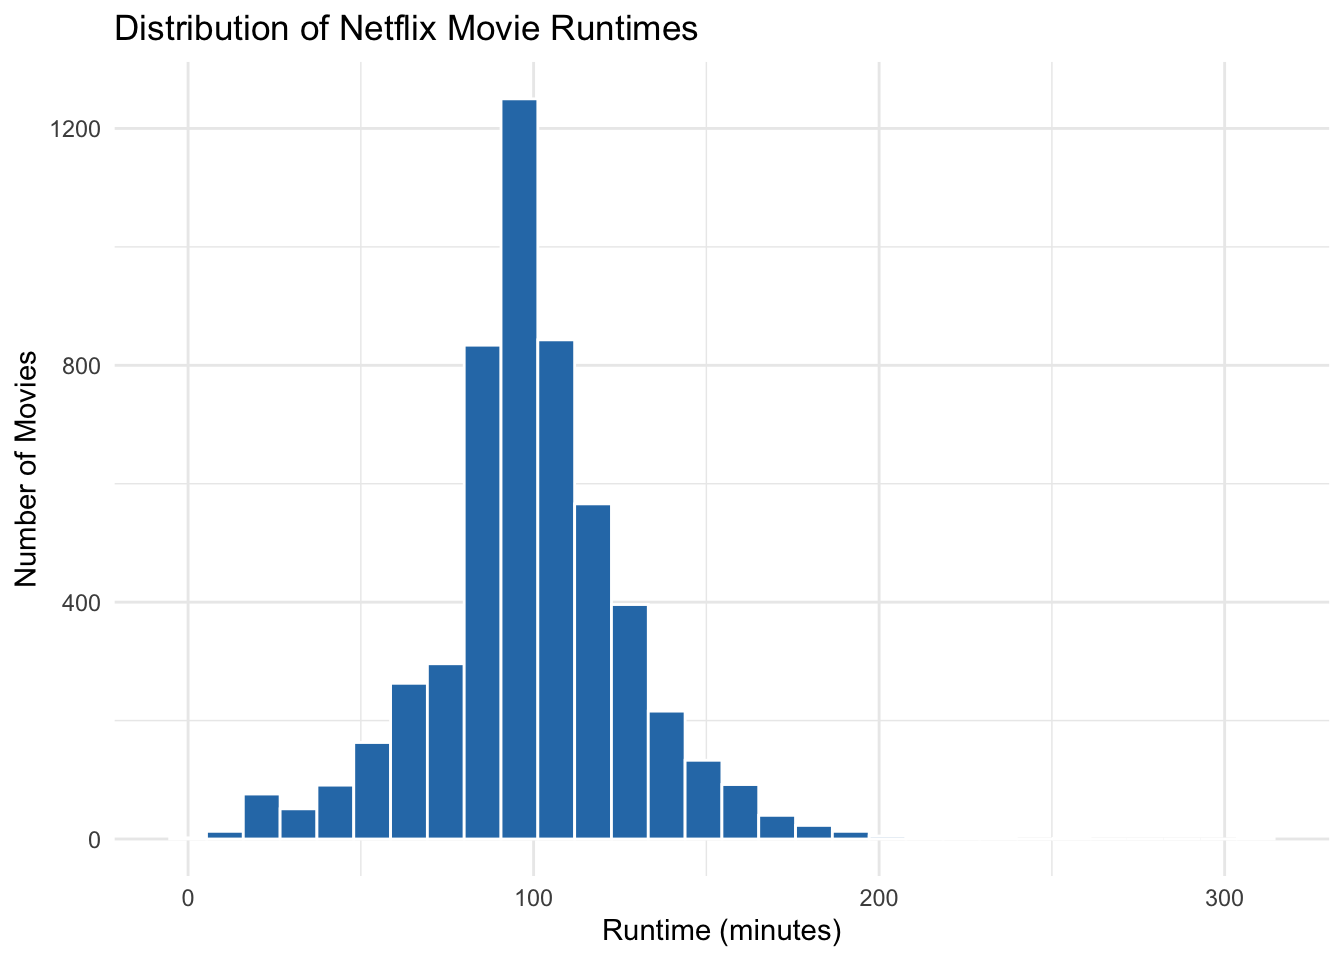
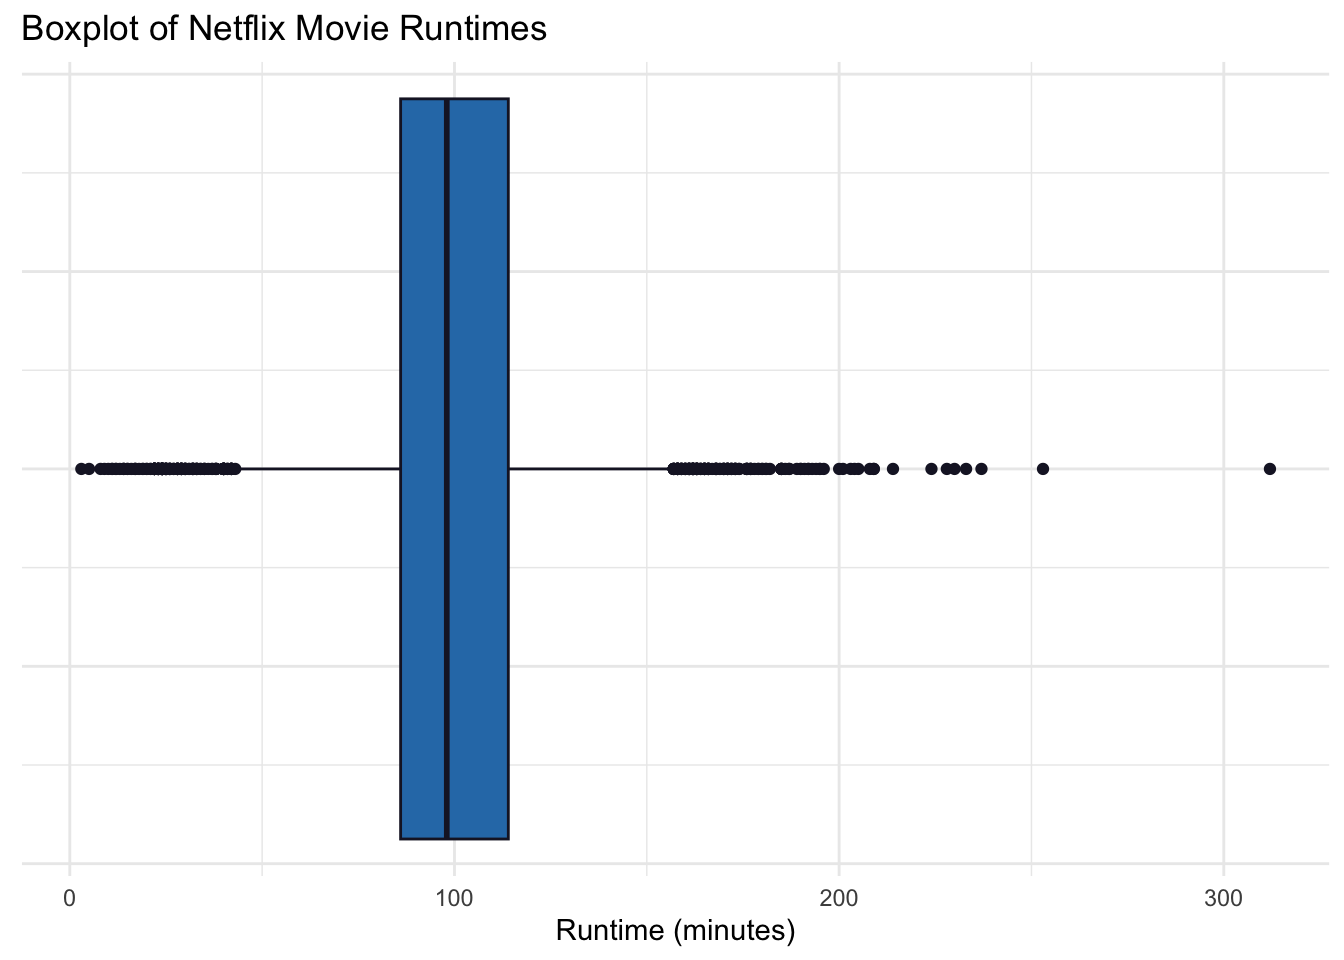
b. Distribution Plots
c. Describe the CENTER of the distribution
Using the summary table above:
- What are the mean and median runtimes? Are they close to each other or notably different?
- Which measure of center better represents a “typical” Netflix movie runtime, and why?
d. Describe the SPREAD of the distribution
Using the summary table above:
- What are the standard deviation and IQR? What do these values tell you about how much movie runtimes vary?
- Which measure of spread is more appropriate here, and why?
e. Describe the SHAPE of the distribution
Using the histogram and boxplot above, along with the relationship between the mean and median:
- Is the distribution symmetric, left-skewed, or right-skewed? Describe what you see.
- Are there any unusual features (outliers, gaps, multiple peaks)? What might explain them?
- A classmate says: “Most Netflix movies are about 90 minutes long.” Does the output above support or challenge this claim? Use specific values from the summary table to justify your answer.
f. Bridge to Probability
Jordan points out that streaming platforms use viewing patterns and content characteristics to estimate probabilities — for example, the likelihood that a subscriber will watch a documentary, or the chance a long movie gets completed in one sitting.
Reflect briefly (2–3 sentences): How does understanding the distribution of a variable (its center, spread, and shape) help set up probability-based questions about that variable? What would you want to know about the distribution before making probability claims?
Part II: Probability
Question 2: Probability Foundations
StreamFlix has 10,000 current subscribers. Answer the following:
a. Define these terms in the context of StreamFlix:
Experiment:
Sample Space:
Event:
Complement:
b. Let A = “subscriber watches action movies” and B = “subscriber watches on mobile device”
Write in words what each represents:
\(A^c\):
\(A \cup B\):
\(A \cap B\):
\(P(A|B)\):
Question 3: Independent vs. Mutually Exclusive Events
Jordan is confused about independence and mutual exclusivity.
a. Definitions
Explain in YOUR OWN WORDS (no textbook definitions):
What makes two events independent?
What makes two events mutually exclusive?
Can two events be both independent AND mutually exclusive? Explain why or why not.
b. Classify these pairs
For each pair, state if they are: Independent, Mutually Exclusive, Both, or Neither. Justify each answer.
| Event Pair | Classification | Justification |
|---|---|---|
| “Subscribes to Premium tier” and “Subscribes to Basic tier” | ||
| “Watches content on weekends” and “Prefers comedy genre” | ||
| “Cancels within 30 days” and “Completes free trial” | ||
| “Uses mobile app” and “Uses smart TV app” (same subscriber can use both) |
Question 4: Addition and Multiplication Rules
StreamFlix data shows:
- 35% of subscribers watch action movies
- 45% of subscribers watch comedies
- 15% of subscribers watch both action movies AND comedies
- 60% of Premium subscribers renew for another month
- 40% of subscribers are on the Premium tier
a. Using the Addition Rule
Calculate \(P(\text{Action OR Comedy})\)
Show your work using the formula: \(P(A \cup B) = P(A) + P(B) - P(A \cap B)\)
b. More Addition Rule Practice
What’s the probability a randomly selected subscriber watches NEITHER action nor comedy?
Show your calculation:
c. Using the Multiplication Rule
What’s the probability that a randomly selected subscriber is BOTH on Premium tier AND renews for another month?
Assume renewal and tier choice are independent. Show your work using: \(P(A \cap B) = P(A) \times P(B)\)
d. Critical Thinking
In part (c), we assumed independence. List TWO reasons why renewal and tier choice might NOT actually be independent in reality:
Question 5: Contingency Table Analysis
StreamFlix surveyed 1,000 subscribers about their viewing habits and subscription status. Here’s the data:
| Canceled Subscription | Active Subscription | Total | |
|---|---|---|---|
| Watches Daily | 80 | 420 | 500 |
| Watches Weekly | 120 | 230 | 350 |
| Watches Rarely | 100 | 50 | 150 |
| Total | 300 | 700 | 1,000 |
a. Define probability types
Using this table as context, explain:
Joint Probability:
Marginal Probability:
Conditional Probability:
b. Calculate the following (show work as fractions, then decimals):
\(P(\text{Watches Daily})\) =
\(P(\text{Canceled})\) =
\(P(\text{Watches Daily AND Canceled})\) =
\(P(\text{Watches Daily OR Canceled})\) =
\(P(\text{Canceled | Watches Daily})\) =
\(P(\text{Canceled | Watches Rarely})\) =
\(P(\text{Watches Daily | Active})\) =
c. Interpretation
Compare \(P(\text{Canceled | Watches Daily})\) with \(P(\text{Canceled | Watches Rarely})\). What does this tell Jordan about viewing frequency and churn risk?
Is viewing frequency independent of subscription status? Provide statistical evidence using the definition: Events A and B are independent if \(P(A|B) = P(A)\).
Question 6: Device Usage Analysis
StreamFlix tracks which devices subscribers use. Here’s data from 2,000 subscribers:
| Mobile Only | TV Only | Both Devices | Total | |
|---|---|---|---|---|
| Premium Tier | 180 | 320 | 300 | 800 |
| Standard Tier | 240 | 360 | 280 | 880 |
| Basic Tier | 150 | 130 | 40 | 320 |
| Total | 570 | 810 | 620 | 2,000 |
a. Calculate:
\(P(\text{Premium Tier})\) =
\(P(\text{Both Devices})\) =
\(P(\text{Premium AND Both Devices})\) =
\(P(\text{Both Devices | Premium})\) =
\(P(\text{Premium | Both Devices})\) =
b. Comparison
Notice that \(P(\text{Both Devices | Premium}) \neq P(\text{Premium | Both Devices})\)
Explain in words what EACH probability means and why they’re different:
c. Business Insight
Which tier has the highest percentage of multi-device users? Show calculation.
What should Jordan conclude about the relationship between tier choice and device usage?
Question 7: Free Trial Conversion
StreamFlix offers a 30-day free trial. Historical data shows:
- 70% of trial users watch at least 5 hours of content
- Of those who watch 5+ hours, 60% convert to paid subscribers
- Of those who watch less than 5 hours, only 15% convert to paid subscribers
a. Create a tree diagram
Sketch a tree diagram showing:
- First branch: Hours watched (5+ hours vs. <5 hours)
- Second branch: Conversion outcome (Convert vs. Don’t Convert)
- Label all probabilities on branches
- Calculate all four endpoint probabilities
b. Calculate:
What’s the probability a trial user BOTH watches 5+ hours AND converts?
What’s the overall probability that a trial user converts (regardless of viewing)? Use the Law of Total Probability: \(P(\text{Convert}) = P(\text{Convert AND 5+ hours}) + P(\text{Convert AND <5 hours})\)
Given that a user converted to paid, what’s the probability they watched 5+ hours during trial? Use Bayes’ Theorem concept (show your work)
c. Recommendation
Based on these probabilities, what strategy would you recommend to increase conversions?
Question 8: Content Preference Patterns
Jordan provides this data on genre preferences and age groups (1,500 subscribers):
| Action | Romance | Documentary | Total | |
|---|---|---|---|---|
| Ages 18-30 | 240 | 180 | 80 | 500 |
| Ages 31-50 | 200 | 220 | 180 | 600 |
| Ages 51+ | 60 | 140 | 200 | 400 |
| Total | 500 | 540 | 460 | 1,500 |
a. Calculate these probabilities:
\(P(\text{Documentary})\) =
\(P(\text{Ages 18-30})\) =
\(P(\text{Documentary AND Ages 51+})\) =
\(P(\text{Documentary | Ages 51+})\) =
\(P(\text{Ages 51+ | Documentary})\) =
b. Independence check
Are age group and genre preference independent?
Test this by checking if \(P(\text{Action | Ages 18-30}) = P(\text{Action})\)
Show your calculations and state your conclusion.
c. Marketing insight
Based on the conditional probabilities, which genre should StreamFlix promote to each age group? Justify with data.
💭 Question 9: Detective’s Reflection
Reflect on your full investigation — from exploratory analysis to probability (5–7 sentences):
- How did the EDA in Question 1 prepare you for the probability work that followed? What’s the relationship between describing a distribution and making probabilistic claims?
- How does understanding conditional probability help businesses make better decisions?
- What’s the difference between \(P(A|B)\) and \(P(B|A)\), and why does this matter in real applications?
- How did contingency tables help you see patterns in the data?
- What surprised you about independence vs. mutual exclusivity?
- Name one other business or real-world scenario where both EDA and probability concepts would be crucial.
🎉 Excellent work, Statistical Detective! StreamFlix is grateful for your insights — from raw data all the way to probability!