Lecture 7: Random Variables and Named Distributions
STAT 7 - Statistical Methods for the Biological, Environmental & Health Sciences
10 Mar 2026
Welcome! Week 4 Overview
| Week | Topics | Readings | Deliverables |
|---|---|---|---|
| Four | Random Variables & Distributions | Sections 4.1, 4.2, 4.3 | Complete HW3 and Practice Exam (HW4) |
| Attend 2 lectures, 1 DSA |
Recap: What We’ve Covered
- Statistics fundamentals & data types
- Descriptive statistics & data visualization
- Exploratory data analysis
- Probability basics
- Conditional probability
- Bayes’ Theorem
Today: We connect probability to real-world phenomena through random variables!
Why Do We Need Probability?
Remember Week 1:
- We want to make inferences about populations
- We can only observe samples
- Need to quantify uncertainty
This Week:
- How do variables behave randomly?
- What patterns do they follow?
- How can we model uncertainty mathematically?
Quick Review: Bayes’ Theorem
Remember the general form:
\[P(A|B) = \frac{P(B|A) \cdot P(A)}{P(B)}\]
Example: Medical Testing
- Disease prevalence: 1% of population
- Test sensitivity: 95% (true positive rate)
- Test specificity: 90% (true negative rate)
If you test positive, what’s the probability you have the disease?
Bayes’ Theorem Example Solution
Let D = has disease, T+ = tests positive
\[P(D|T+) = \frac{P(T+|D) \cdot P(D)}{P(T+)}\]
- \(P(D) = 0.01\)
- \(P(T+|D) = 0.95\)
- \(P(T+) = P(T+|D) \cdot P(D) + P(T+|D^c) \cdot P(D^c)\)
- \(P(T+) = 0.95(0.01) + 0.10(0.99) = 0.1085\)
\[P(D|T+) = \frac{0.95 \times 0.01}{0.1085} \approx 0.088\]
Only 8.8% chance! Base rates matter enormously.
Today’s Topics
- Random Variables
- Expected Value & Variance
- Named Probability Distributions
- Binomial Distribution
Random Variables
What is a Random Variable?
Definition: A random variable is a function that assigns a numerical value to each outcome of a random phenomenon.
Example:
Flip a coin 3 times
Let X = number of heads
X maps outcomes to numbers
Random Variables: Examples
Which of these are random variables?
- The number of students absent tomorrow
- Tomorrow’s high temperature in °C
- The color of the next car you see
- Time until your next email arrives
- Whether it rains tomorrow (Yes/No)
Types of Random Variables
Discrete
- Countable values
- Often whole numbers
- Gaps between values
Examples:
- Number of heads in 10 flips
- Number of eggs in a nest
- Number of students in class
Continuous
- Uncountable values
- Any value in an interval
- No gaps
Examples:
- Height of a person
- Time to complete a task
- Temperature
- Rainfall amount
Classification Exercise
Classify each as discrete or continuous:
- Number of heads in three tosses of a coin → Discrete
- Time to finish a marathon (in seconds) → Continuous
- Number of eggs in an eagle’s nest → Discrete
- Body mass of whales (in kg) → Continuous
- Number of accidents at an intersection in a year
- Daily rainfall amount (in inches)
- Number of people with type O blood in a sample
- Plant height (in meters)
Probability Distributions
For a discrete random variable X:
Probability Distribution = List of all possible values and their probabilities
Requirements:
- \(0 \leq P(X = x) \leq 1\) for all x
- \(\sum_{all\ x} P(X = x) = 1\)
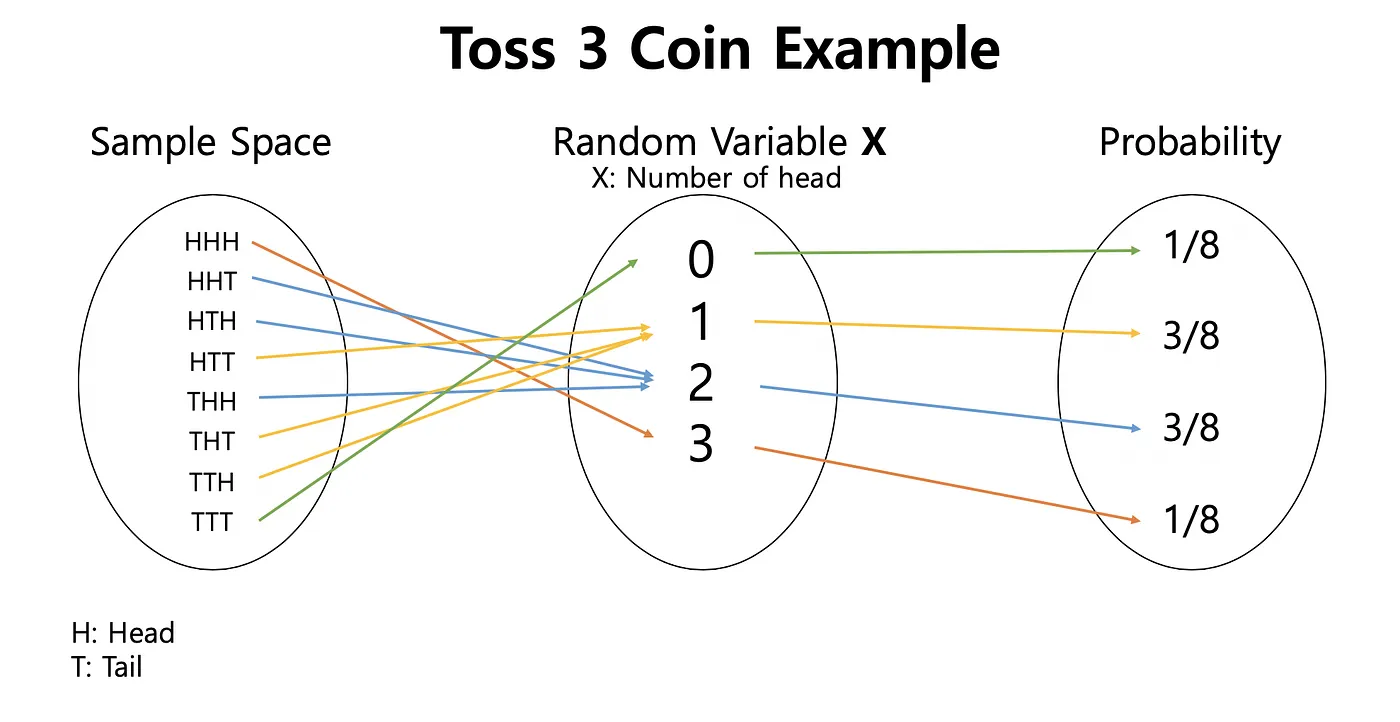
Example: Coin Flips
Flip a fair coin 3 times. Let X = number of heads.
Sample Space:
TTT, TTH, THT, HTT, THH, HTH, HHT, HHH
Probability Distribution:
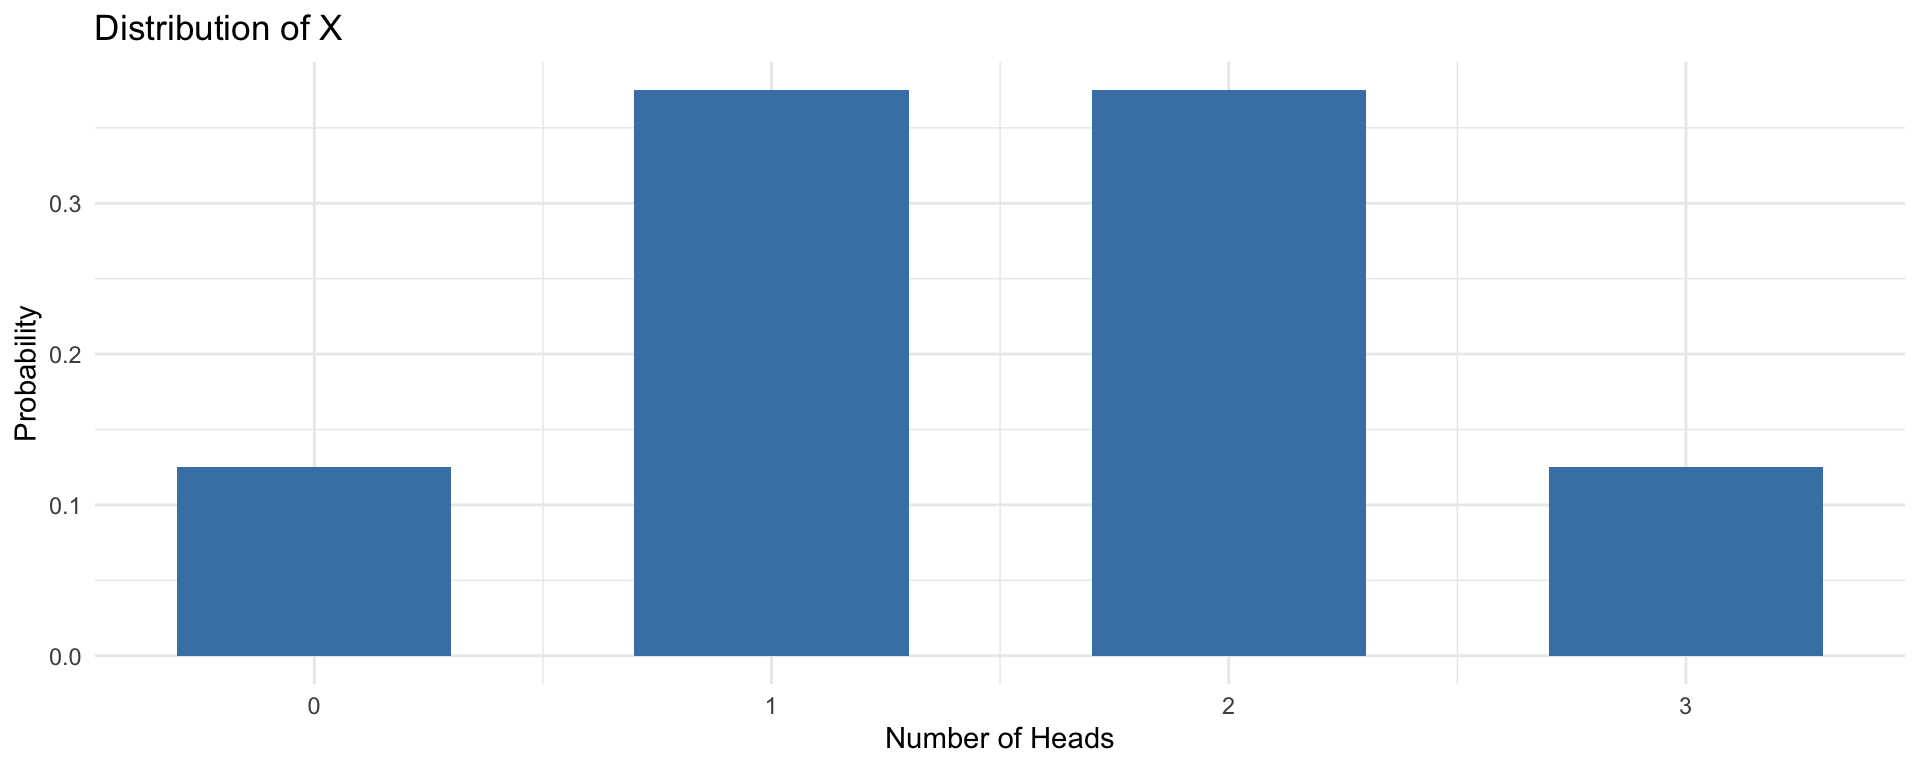
| X | 0 | 1 | 2 | 3 |
|---|---|---|---|---|
| P(X) | 1/8 | 3/8 | 3/8 | 1/8 |
Visualization:
Expected Value (Mean)
Expected Value = long-run average value of the random variable
For discrete X:
\[E(X) = \mu = \sum_{all\ x} x \cdot P(X = x)\]
Example (coin flips):
\[E(X) = 0 \cdot \frac{1}{8} + 1 \cdot \frac{3}{8} + 2 \cdot \frac{3}{8} + 3 \cdot \frac{1}{8} = 1.5\]
Variance and Standard Deviation
Variance = average squared deviation from the mean
\[Var(X) = \sigma^2 = \sum_{all\ x} (x - \mu)^2 \cdot P(X = x)\]
Standard Deviation:
\[SD(X) = \sigma = \sqrt{Var(X)}\]
Measures the spread or variability of the distribution
Calculate Together
For our coin flip example (X = number of heads in 3 flips):
We found: \(E(X) = 1.5\)
Calculate Variance:
\[\begin{align} Var(X) &= (0-1.5)^2 \cdot \frac{1}{8} + (1-1.5)^2 \cdot \frac{3}{8} \\ &\quad + (2-1.5)^2 \cdot \frac{3}{8} + (3-1.5)^2 \cdot \frac{1}{8} \\ &= 2.25 \cdot \frac{1}{8} + 0.25 \cdot \frac{3}{8} + 0.25 \cdot \frac{3}{8} + 2.25 \cdot \frac{1}{8} \\ &= 0.75 \end{align}\]
Standard Deviation: \(SD(X) = \sqrt{0.75} \approx 0.87\)
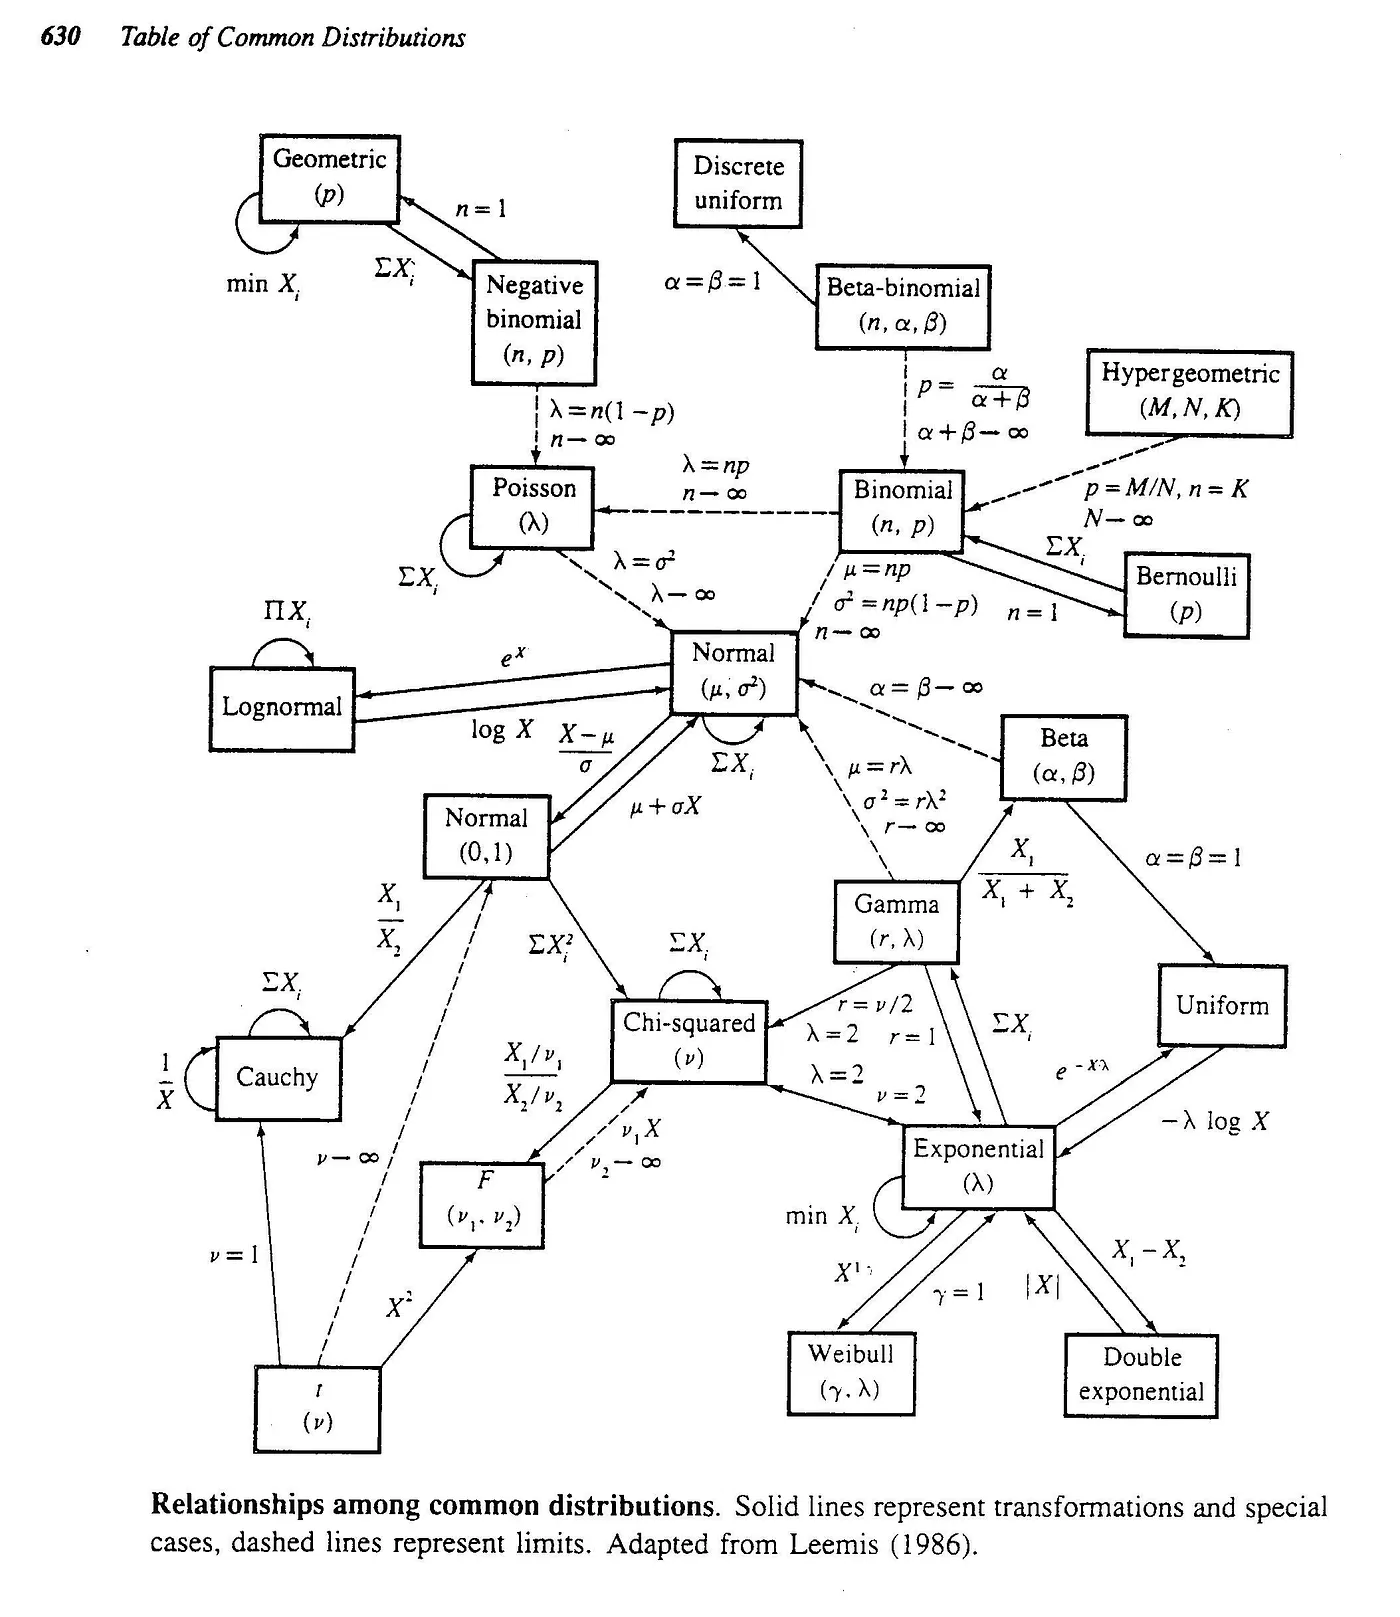
Named Probability Distributions
Why Named Distributions?
Rather than deriving probability distributions from scratch every time, statisticians have identified common patterns:
- Binomial: Success/failure trials
- Normal: Bell-curved continuous data
- Poisson: Rare events over time/space
- Exponential: Time until an event
- And many more!
Each has a specific formula and properties.
Family of Distributions
Today we focus on Binomial and Normal
Binomial Distribution
The Binomial Setting
Four conditions must be met:
- Fixed number of trials (n)
- Each trial has two outcomes (success/failure)
- Trials are independent
- Probability of success (p) is constant for each trial
Notation: \(X \sim Binomial(n, p)\) or \(X \sim Bin(n, p)\)
X = number of successes in n trials
Binomial Example: Plant Germination
A botanist plants 50 seeds, each with 80% germination probability.
Check the conditions:
- Fixed trials? Yes, n = 50 seeds
- Two outcomes? Yes, germinates or doesn’t
- Independent? Yes, separate containers
- Constant probability? Yes, p = 0.80 for each
✓ This is a Binomial setting!
Binomial Formula
Probability of exactly k successes:
\[P(X = k) = \binom{n}{k} p^k (1-p)^{n-k}\]
Where:
- \(\binom{n}{k} = \frac{n!}{k!(n-k)!}\) is the binomial coefficient
- \(n\) = number of trials
- \(k\) = number of successes
- \(p\) = probability of success
Mean and Variance:
\[E(X) = np \qquad Var(X) = np(1-p)\]
Binomial Calculation Example
Setup: 10 seeds, p = 0.8
What’s the probability exactly 10 seeds germinate?
\[P(X = 10) = \binom{10}{10} (0.8)^{10}(0.2)^{0}\]
\[= 1 \times 0.107 \times 1 = 0.107\]
About 10.7% chance all 10 germinate
Using Google Sheets for Binomial
We don’t calculate by hand! Use BINOM.DIST()
Syntax:
=BINOM.DIST(k, n, p, cumulative)k= number of successesn= number of trialsp= probability of successcumulative= FALSE for P(X = k), TRUE for P(X ≤ k)
Example: =BINOM.DIST(10, 10, 0.8, FALSE) gives 0.107
Practice Problem: Plant Seeds
A botanist plants 10 seeds, each with 80% germination probability.
Calculate:
- P(exactly 10 germinate)
=BINOM.DIST(10, 10, 0.8, FALSE)= 0.107
- P(fewer than 5 germinate)
=BINOM.DIST(4, 10, 0.8, TRUE)= 0.0064
- P(more than 6 germinate)
=1 - BINOM.DIST(6, 10, 0.8, TRUE)= 0.879
- Expected number that germinate
- \(E(X) = np = 10 \times 0.8 = 8\)
Binomial Distribution Shape
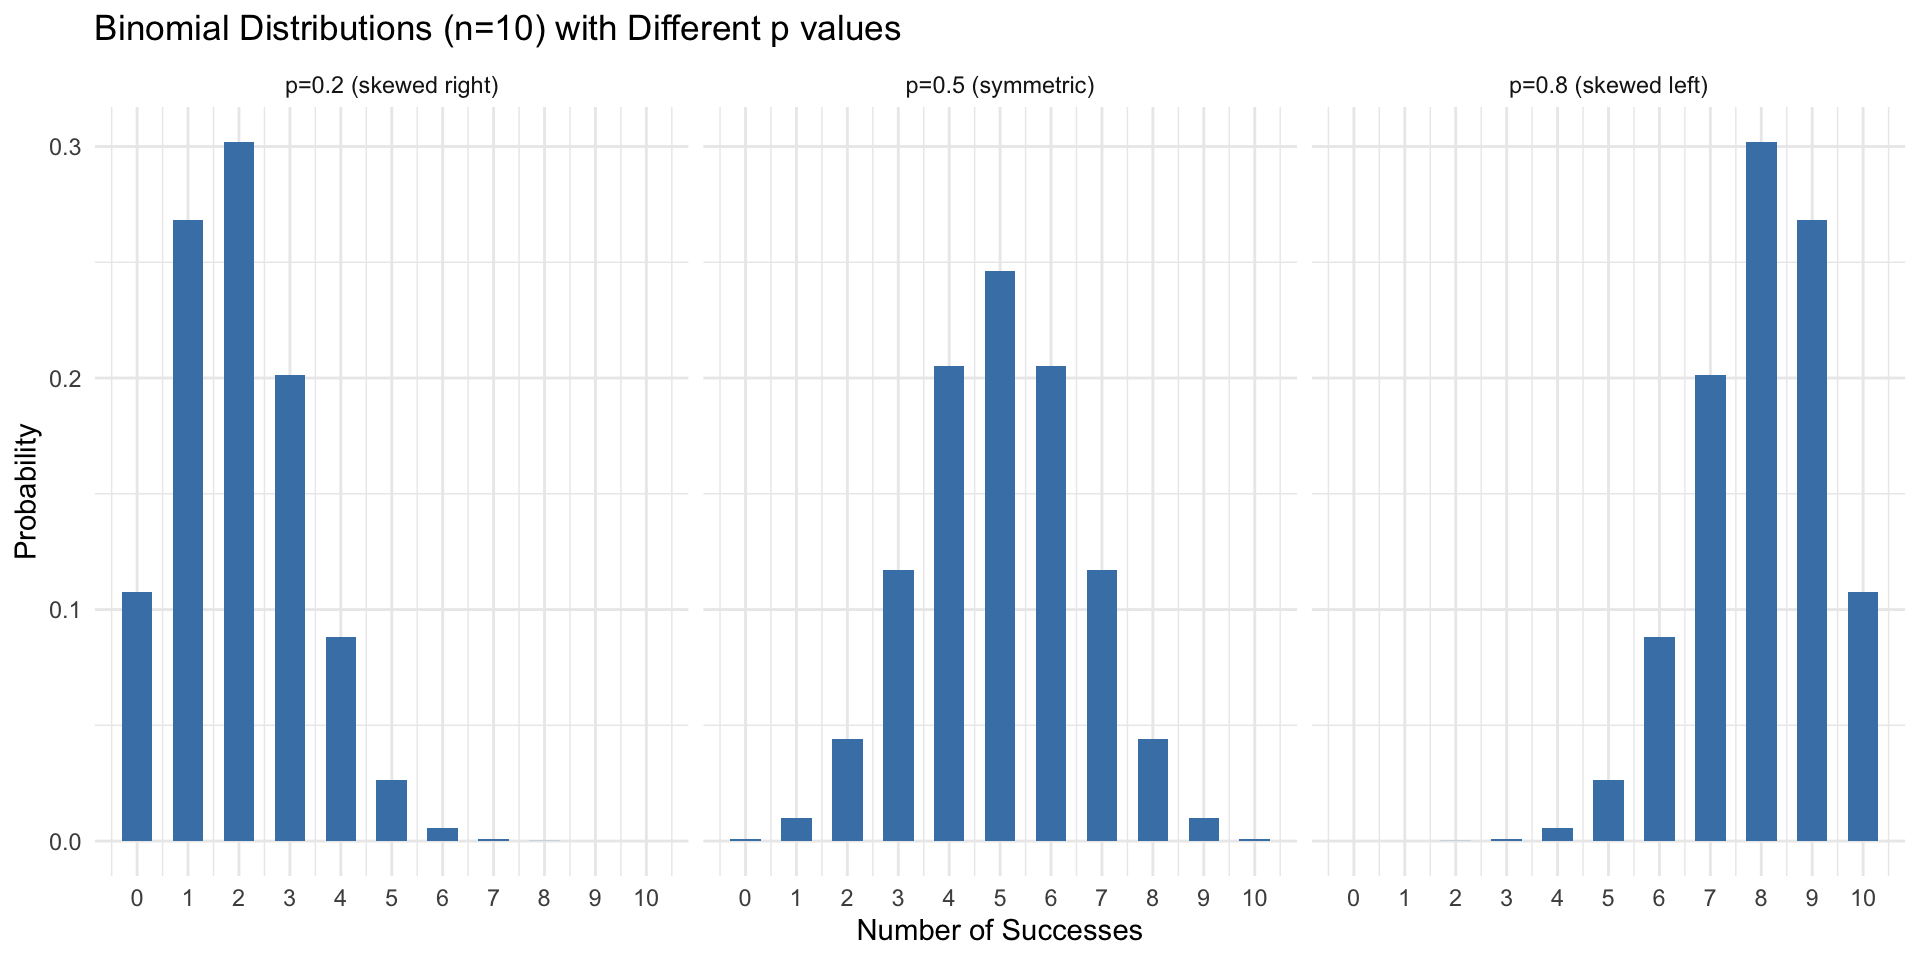
Shape depends on p: symmetric when p=0.5, skewed otherwise
Stretch Break!

Let’s take 2 minutes to stretch!

Looking Ahead: Thursday
We’ll cover:
- Everything about the Normal distribution
- Normal approximation to binomial (when is it appropriate?)
- Sampling distributions
- Central Limit Theorem
- Parameters vs. Statistics
Be ready to connect probability to inference!
Exit Ticket
Before you leave, please complete:
One question you still have about random variables or distributions
Complete by Friday:
- HW 3 on Canvas
Complete during Discussion Section:
- DSA 4
Study for Midterm (next week!)
Office hours available - check Ed Discussion for times
Summary
- Random variables assign numbers to outcomes
- Discrete vs continuous
- Expected value, variance, standard deviation
- Binomial: Fixed trials, constant probability
- Use Google Sheets to calculate probabilities!
Questions?
![]()
STAT 7 – Winter 2026