Lecture 4: Data Visualization & Relationships
STAT 7 - Statistical Methods for the Biological, Environmental & Health Sciences
10 Mar 2026
Meet the Penguins!

Note
Palmer Archipelago (Antarctica) penguin data were collected and made available by Dr. Kristen Gorman and the Palmer Station, Antarctica LTER.
See more info here.
The Dataset
Variables:
species: penguin species (Chinstrap, Adélie, or Gentoo)culmen_length_mm: culmen length (mm)culmen_depth_mm: culmen depth (mm)flipper_length_mm: flipper length (mm)body_mass_g: body mass (g)sex: penguin sex (female or male)island: island name (Dream, Torgersen, or Biscoe)

Activity: Types of Variables
Poll Question
Classify each variable as:
- Categorical (Nominal or Ordinal)
- Numerical (Discrete or Continuous)
Data: Google Sheets Link
Poll: PollEv.com/slugstats

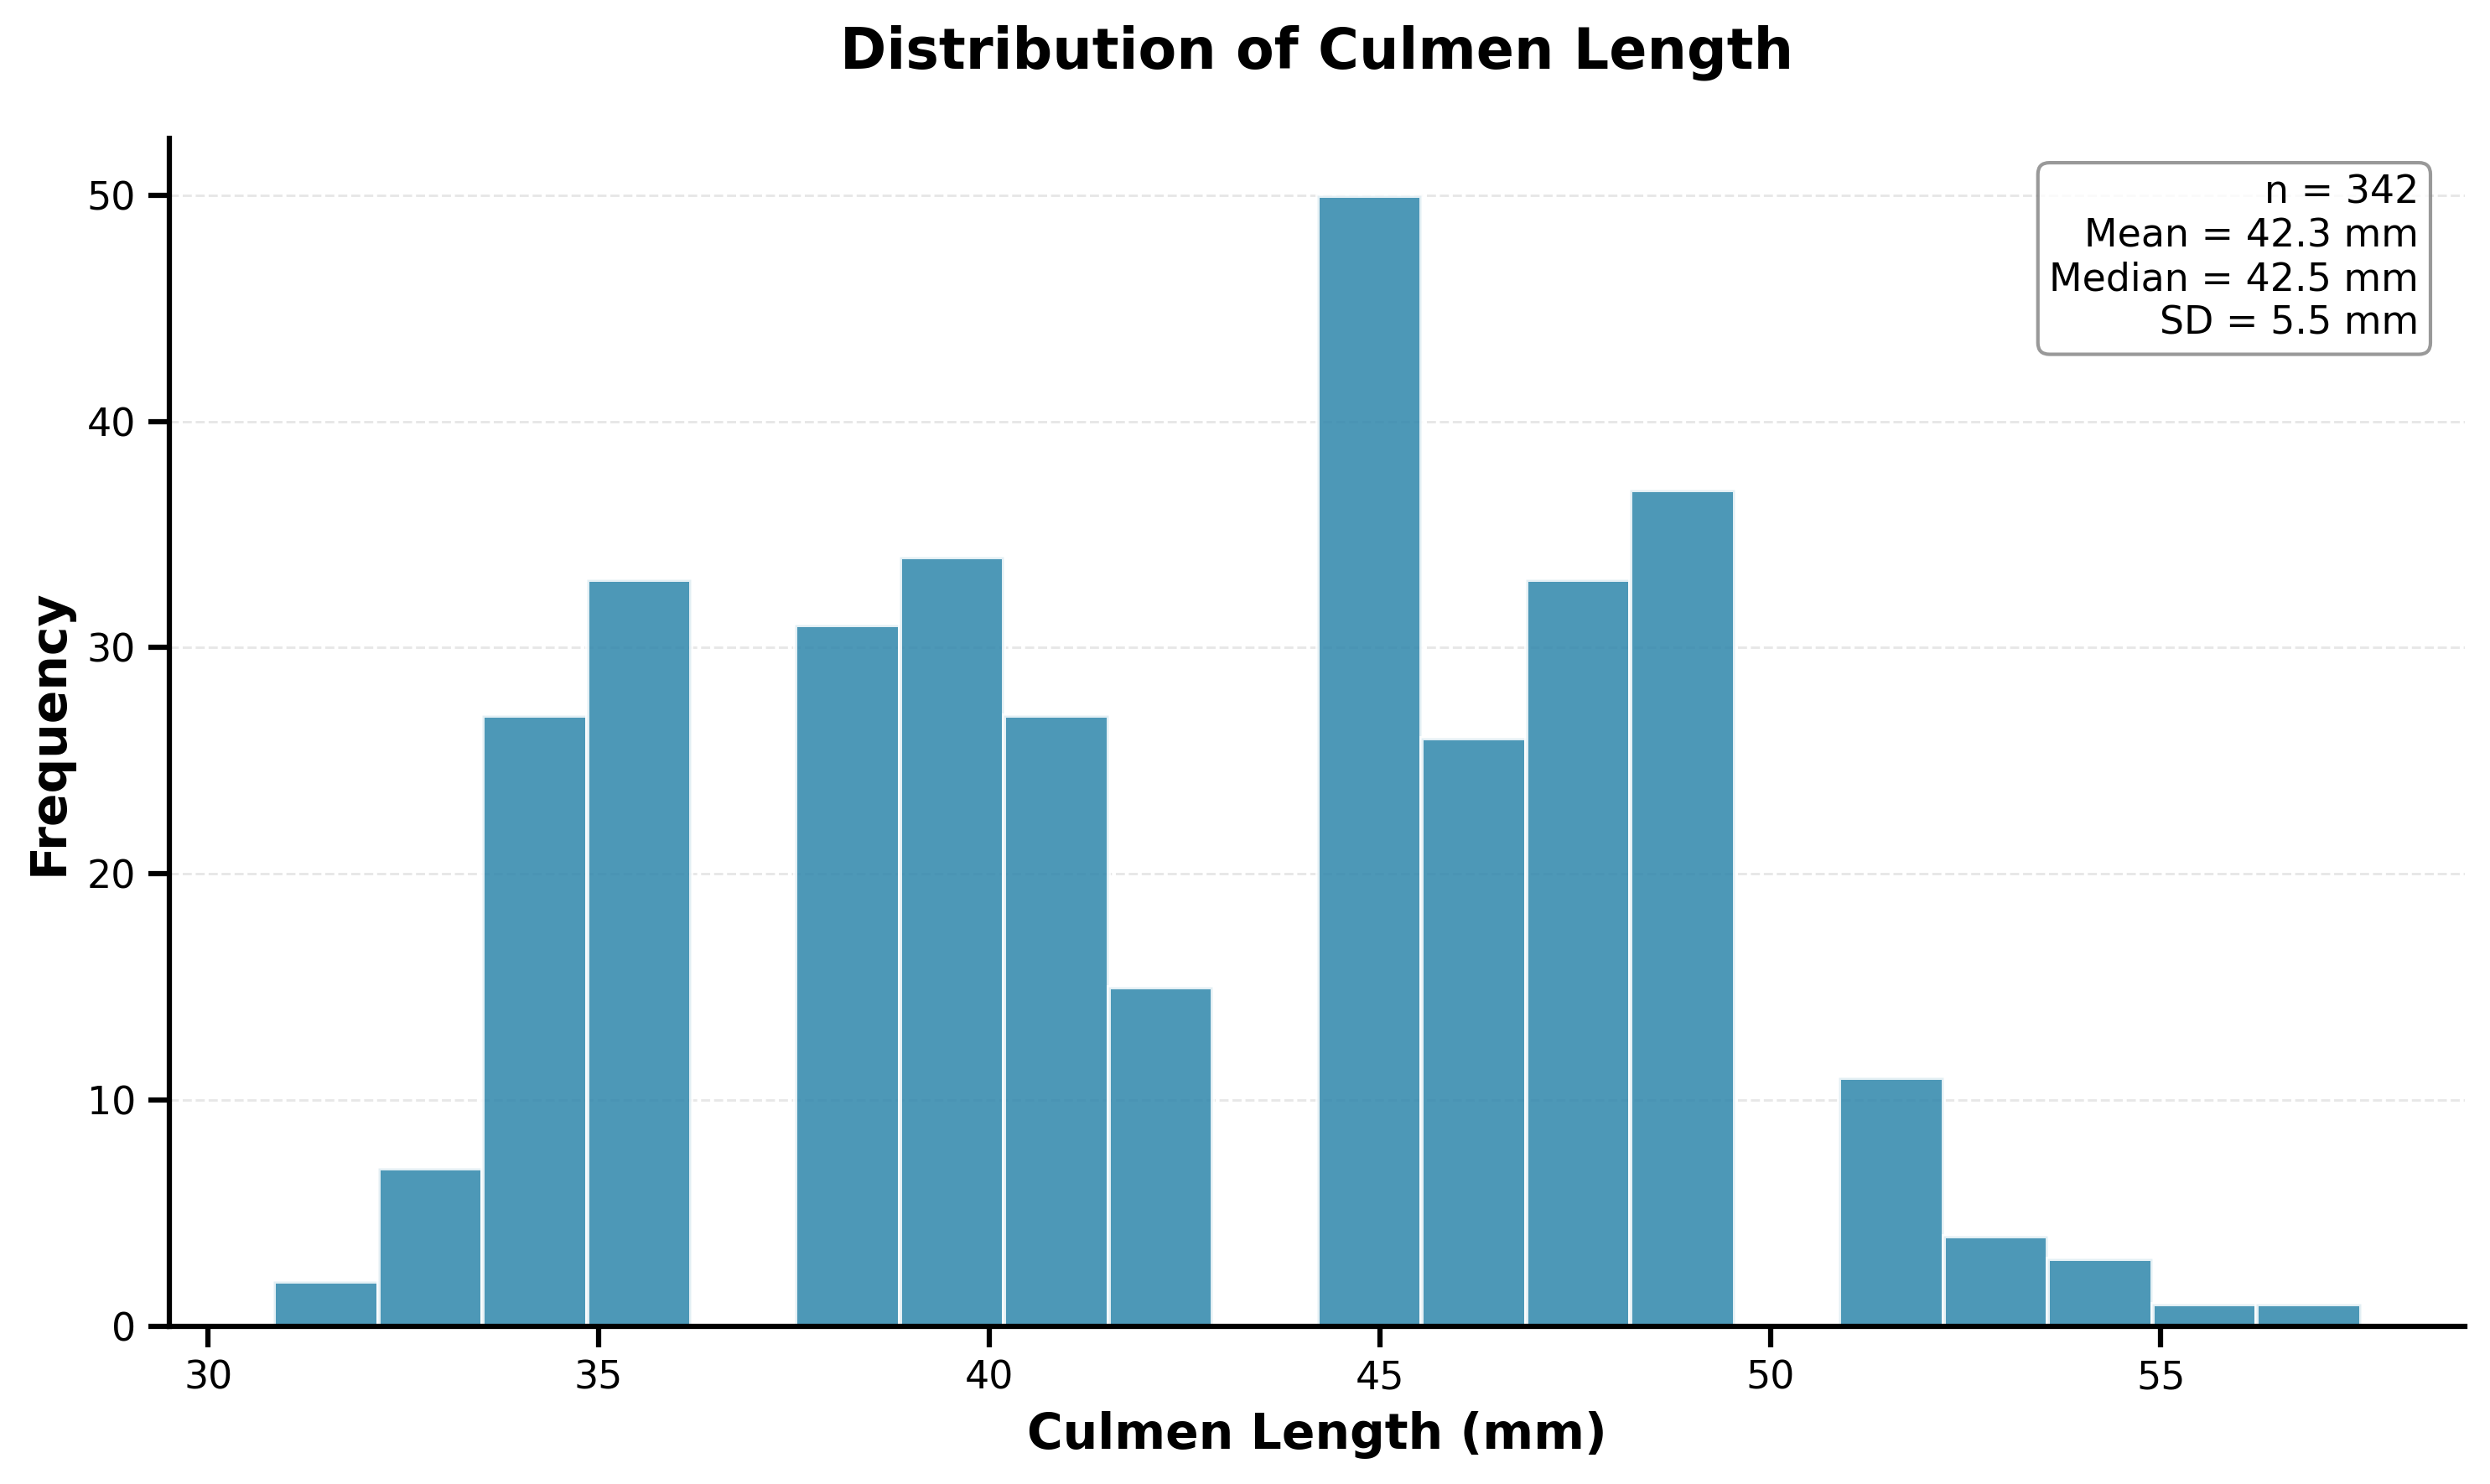
Histogram: Culmen Length
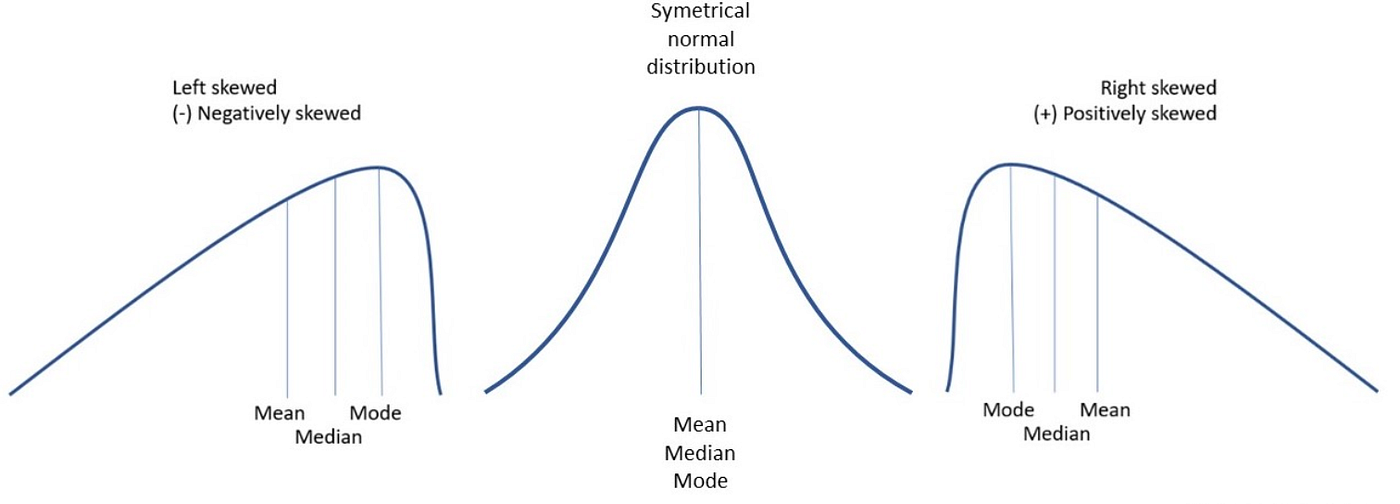
Skewness
Activity: Interpret Histograms
Your Task
For each histogram, describe: 1. Shape (symmetric, skewed left, skewed right) 2. Center (approximately) 3. Spread (range, typical deviation) 4. Any unusual features
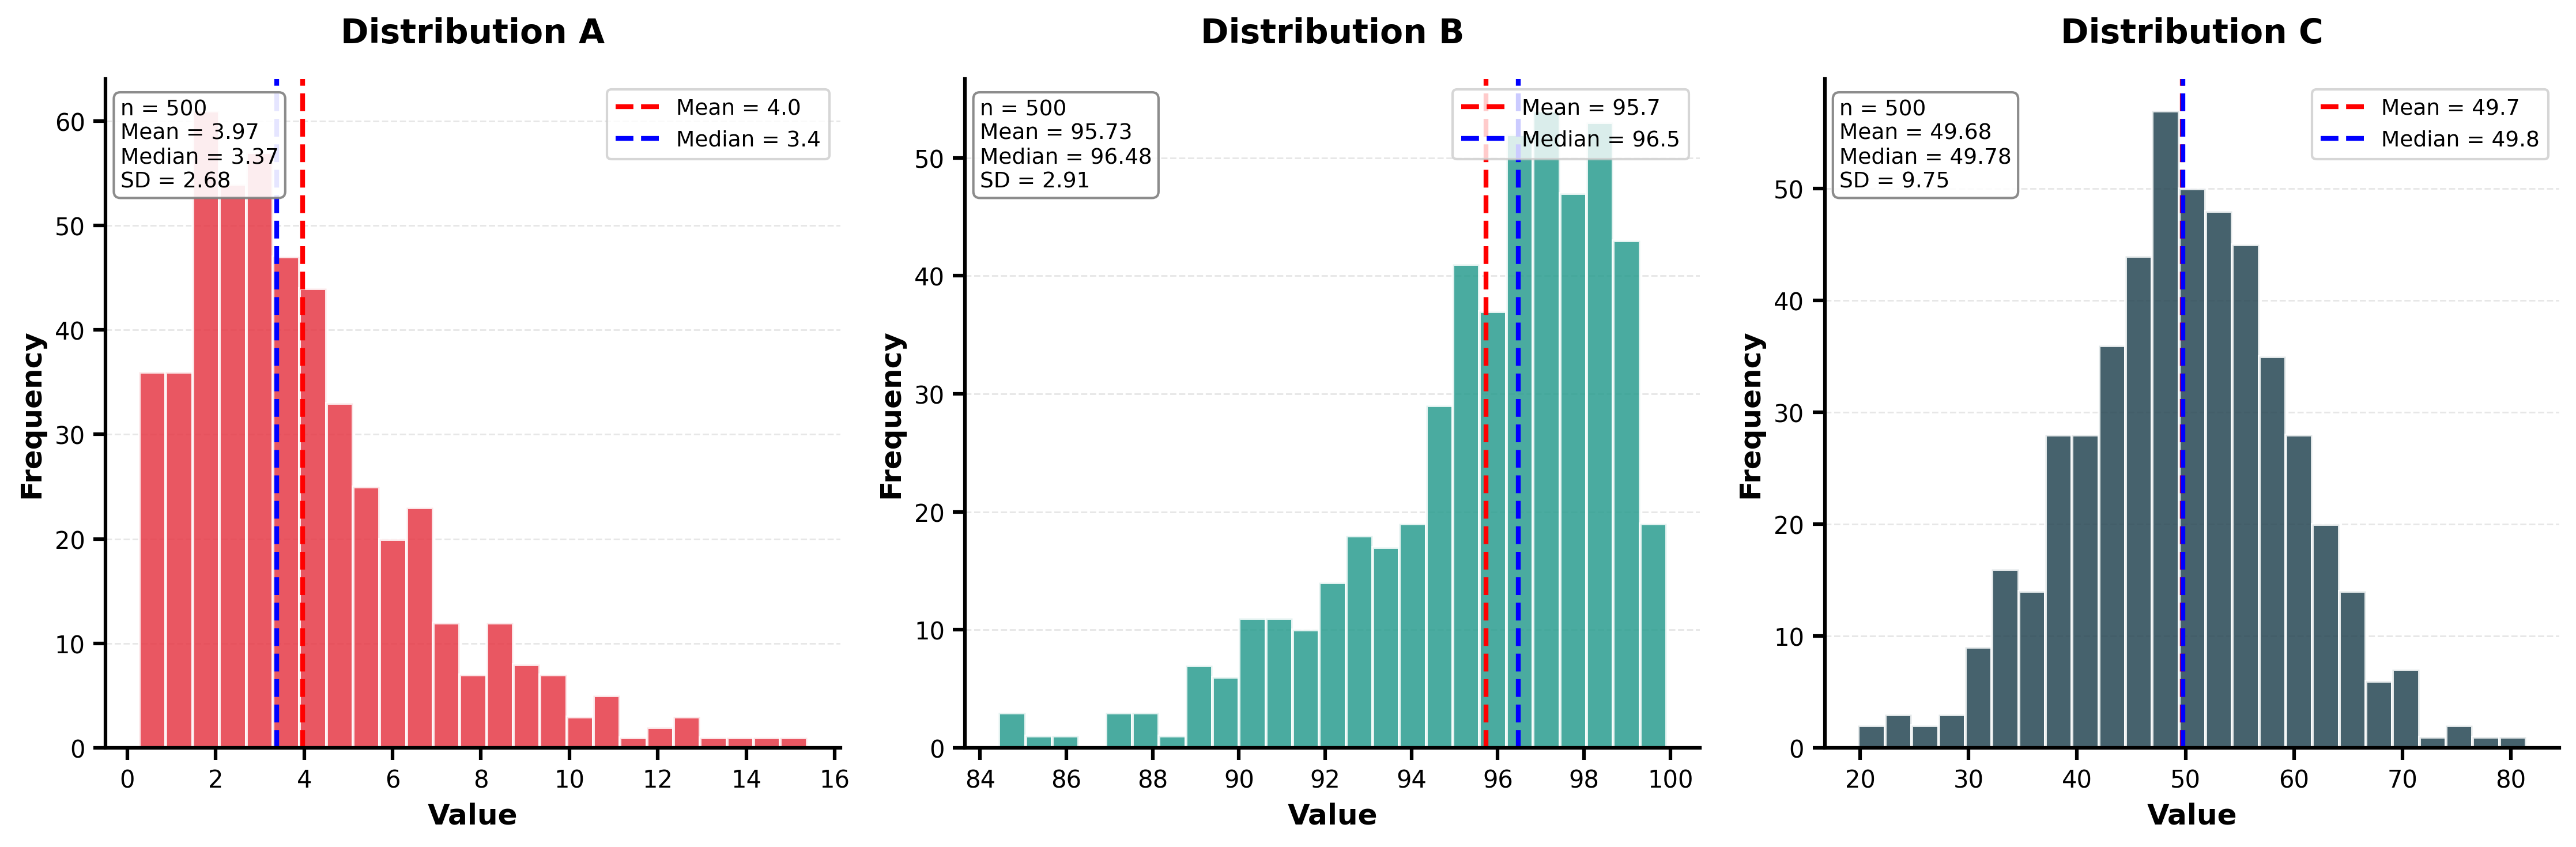
Multiple Histograms
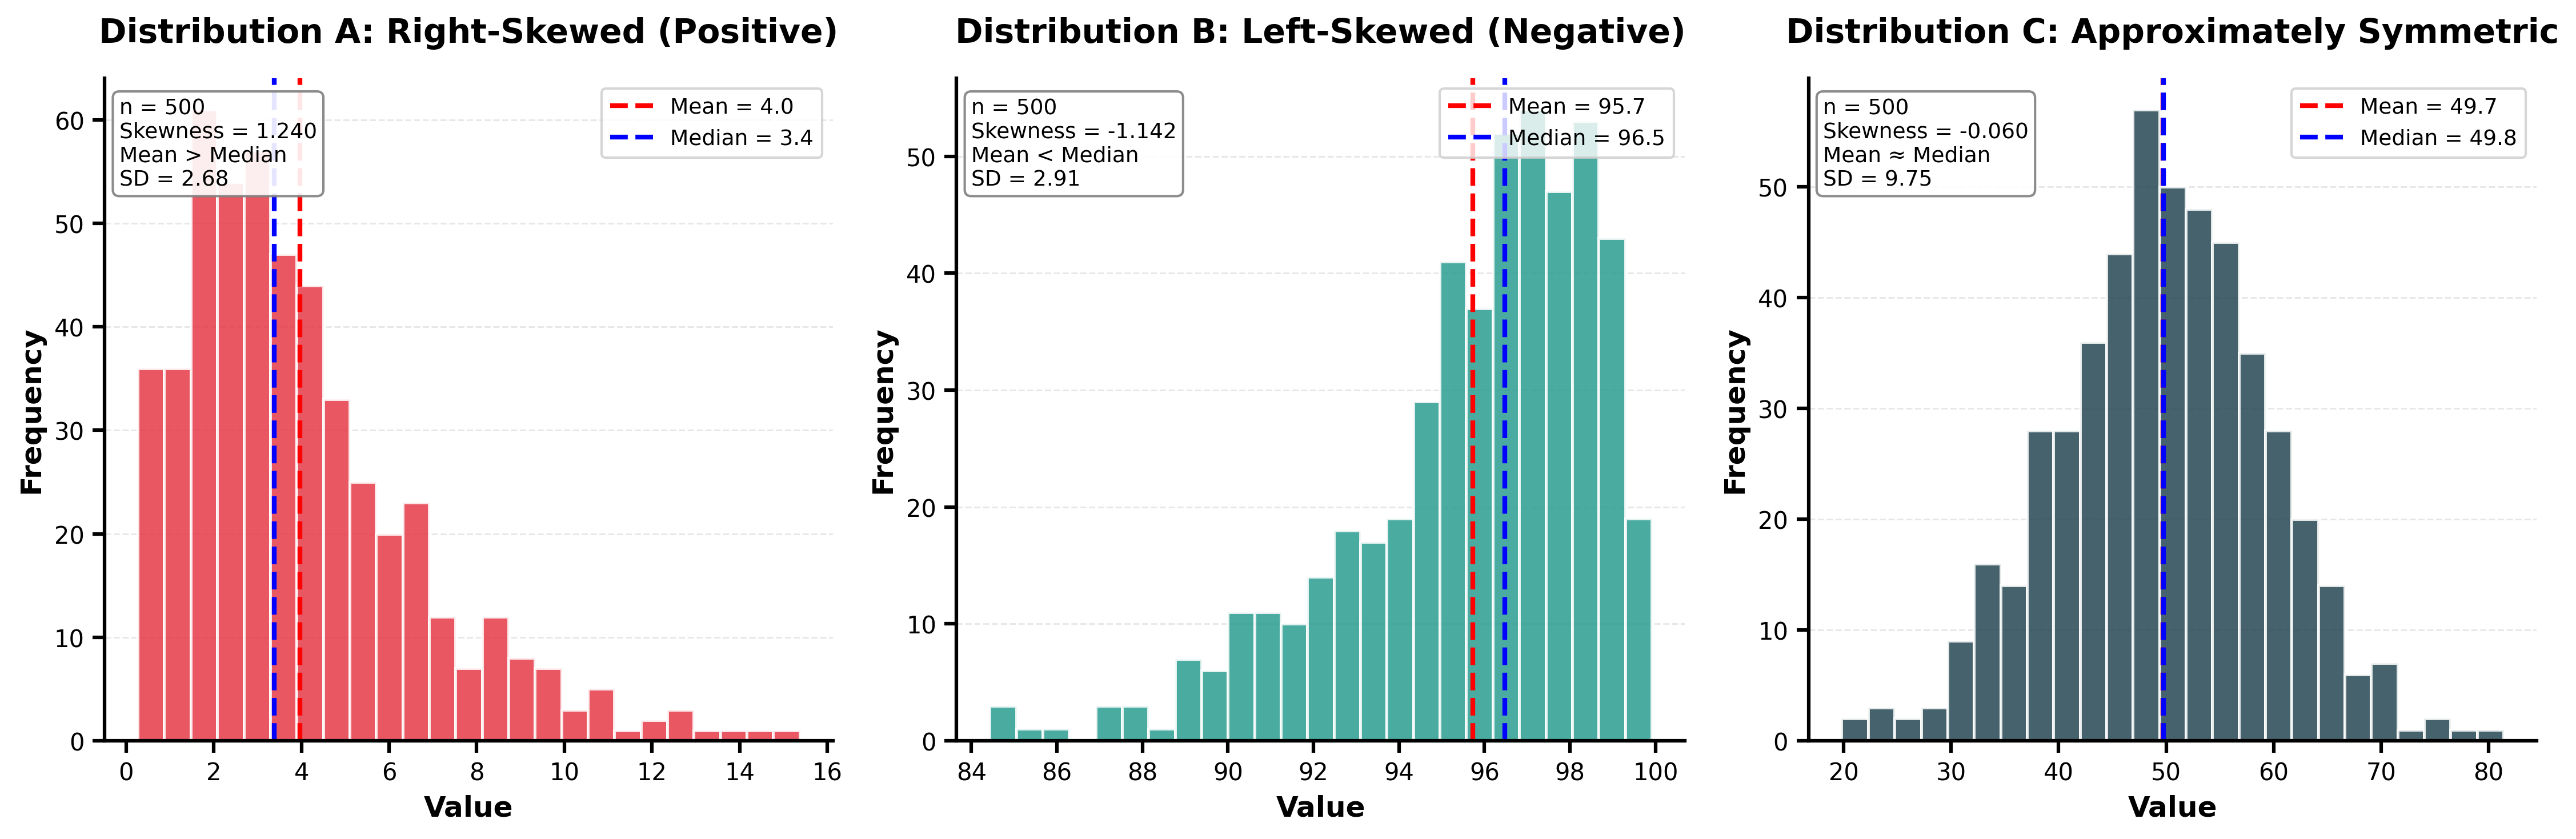
Question: Should we compare directly the different distributions? Why or why not?
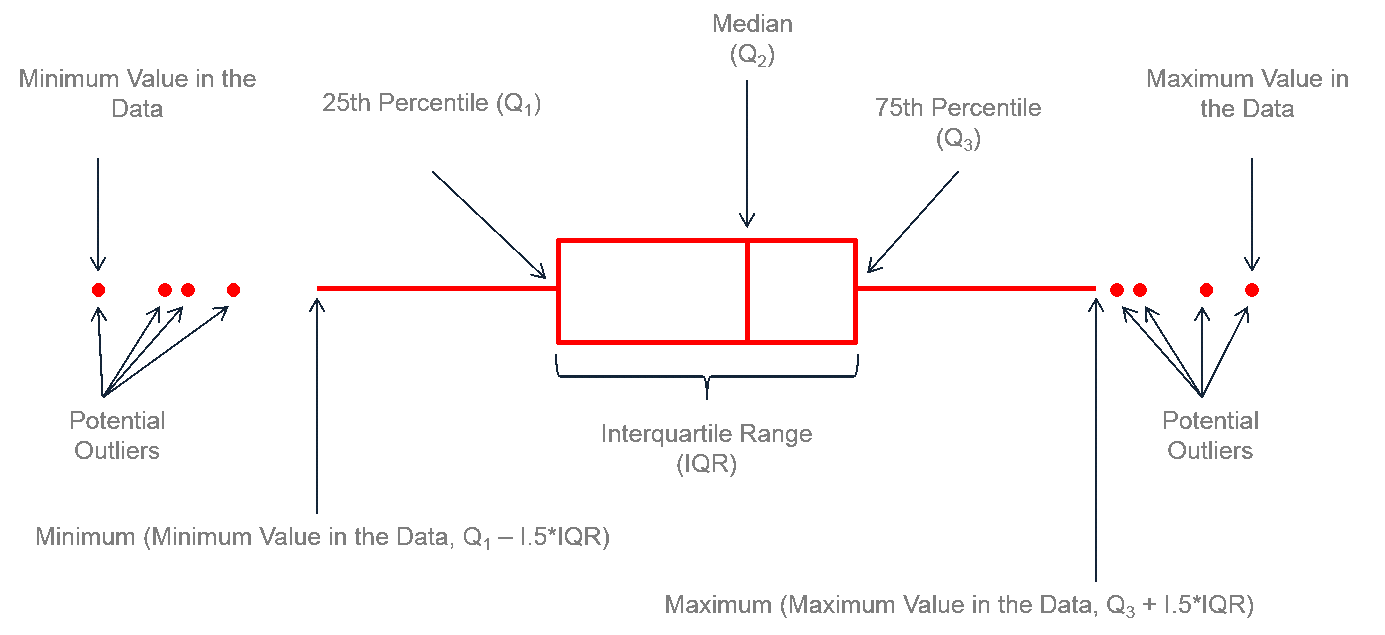
Box Plots: Overview
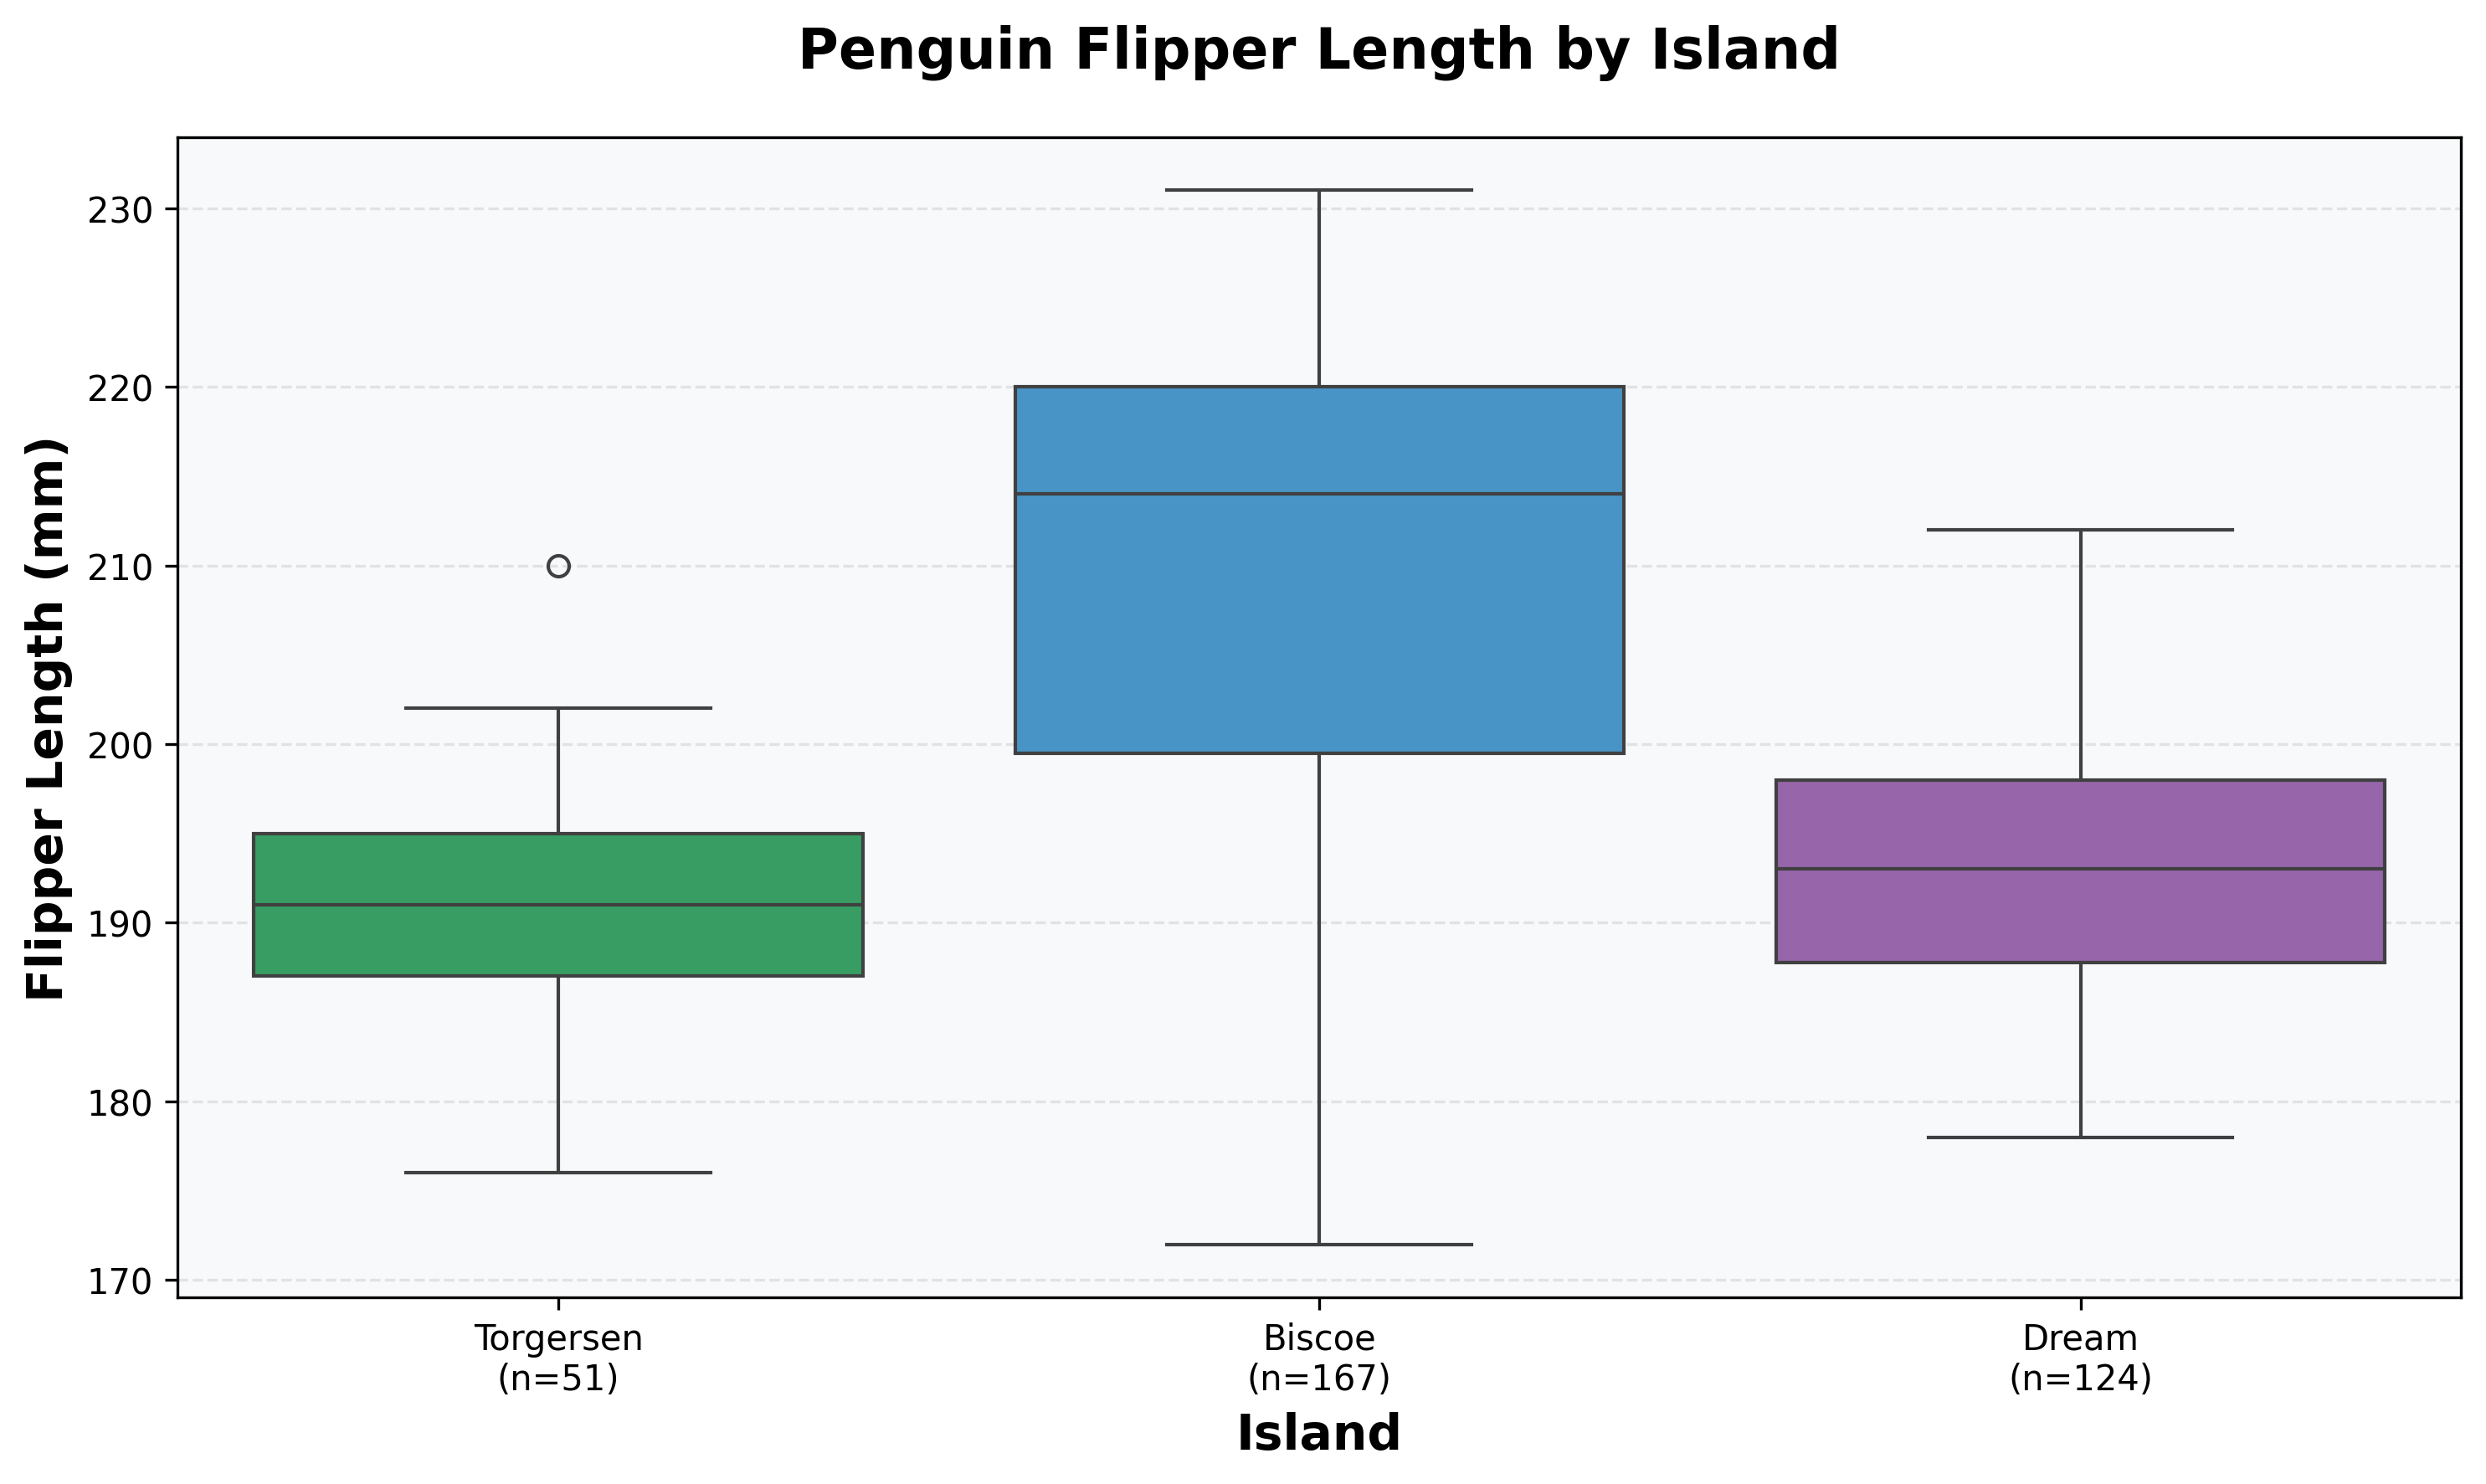
Box Plots: Flipper Length by Island
Box Plots: Flipper Length by Species
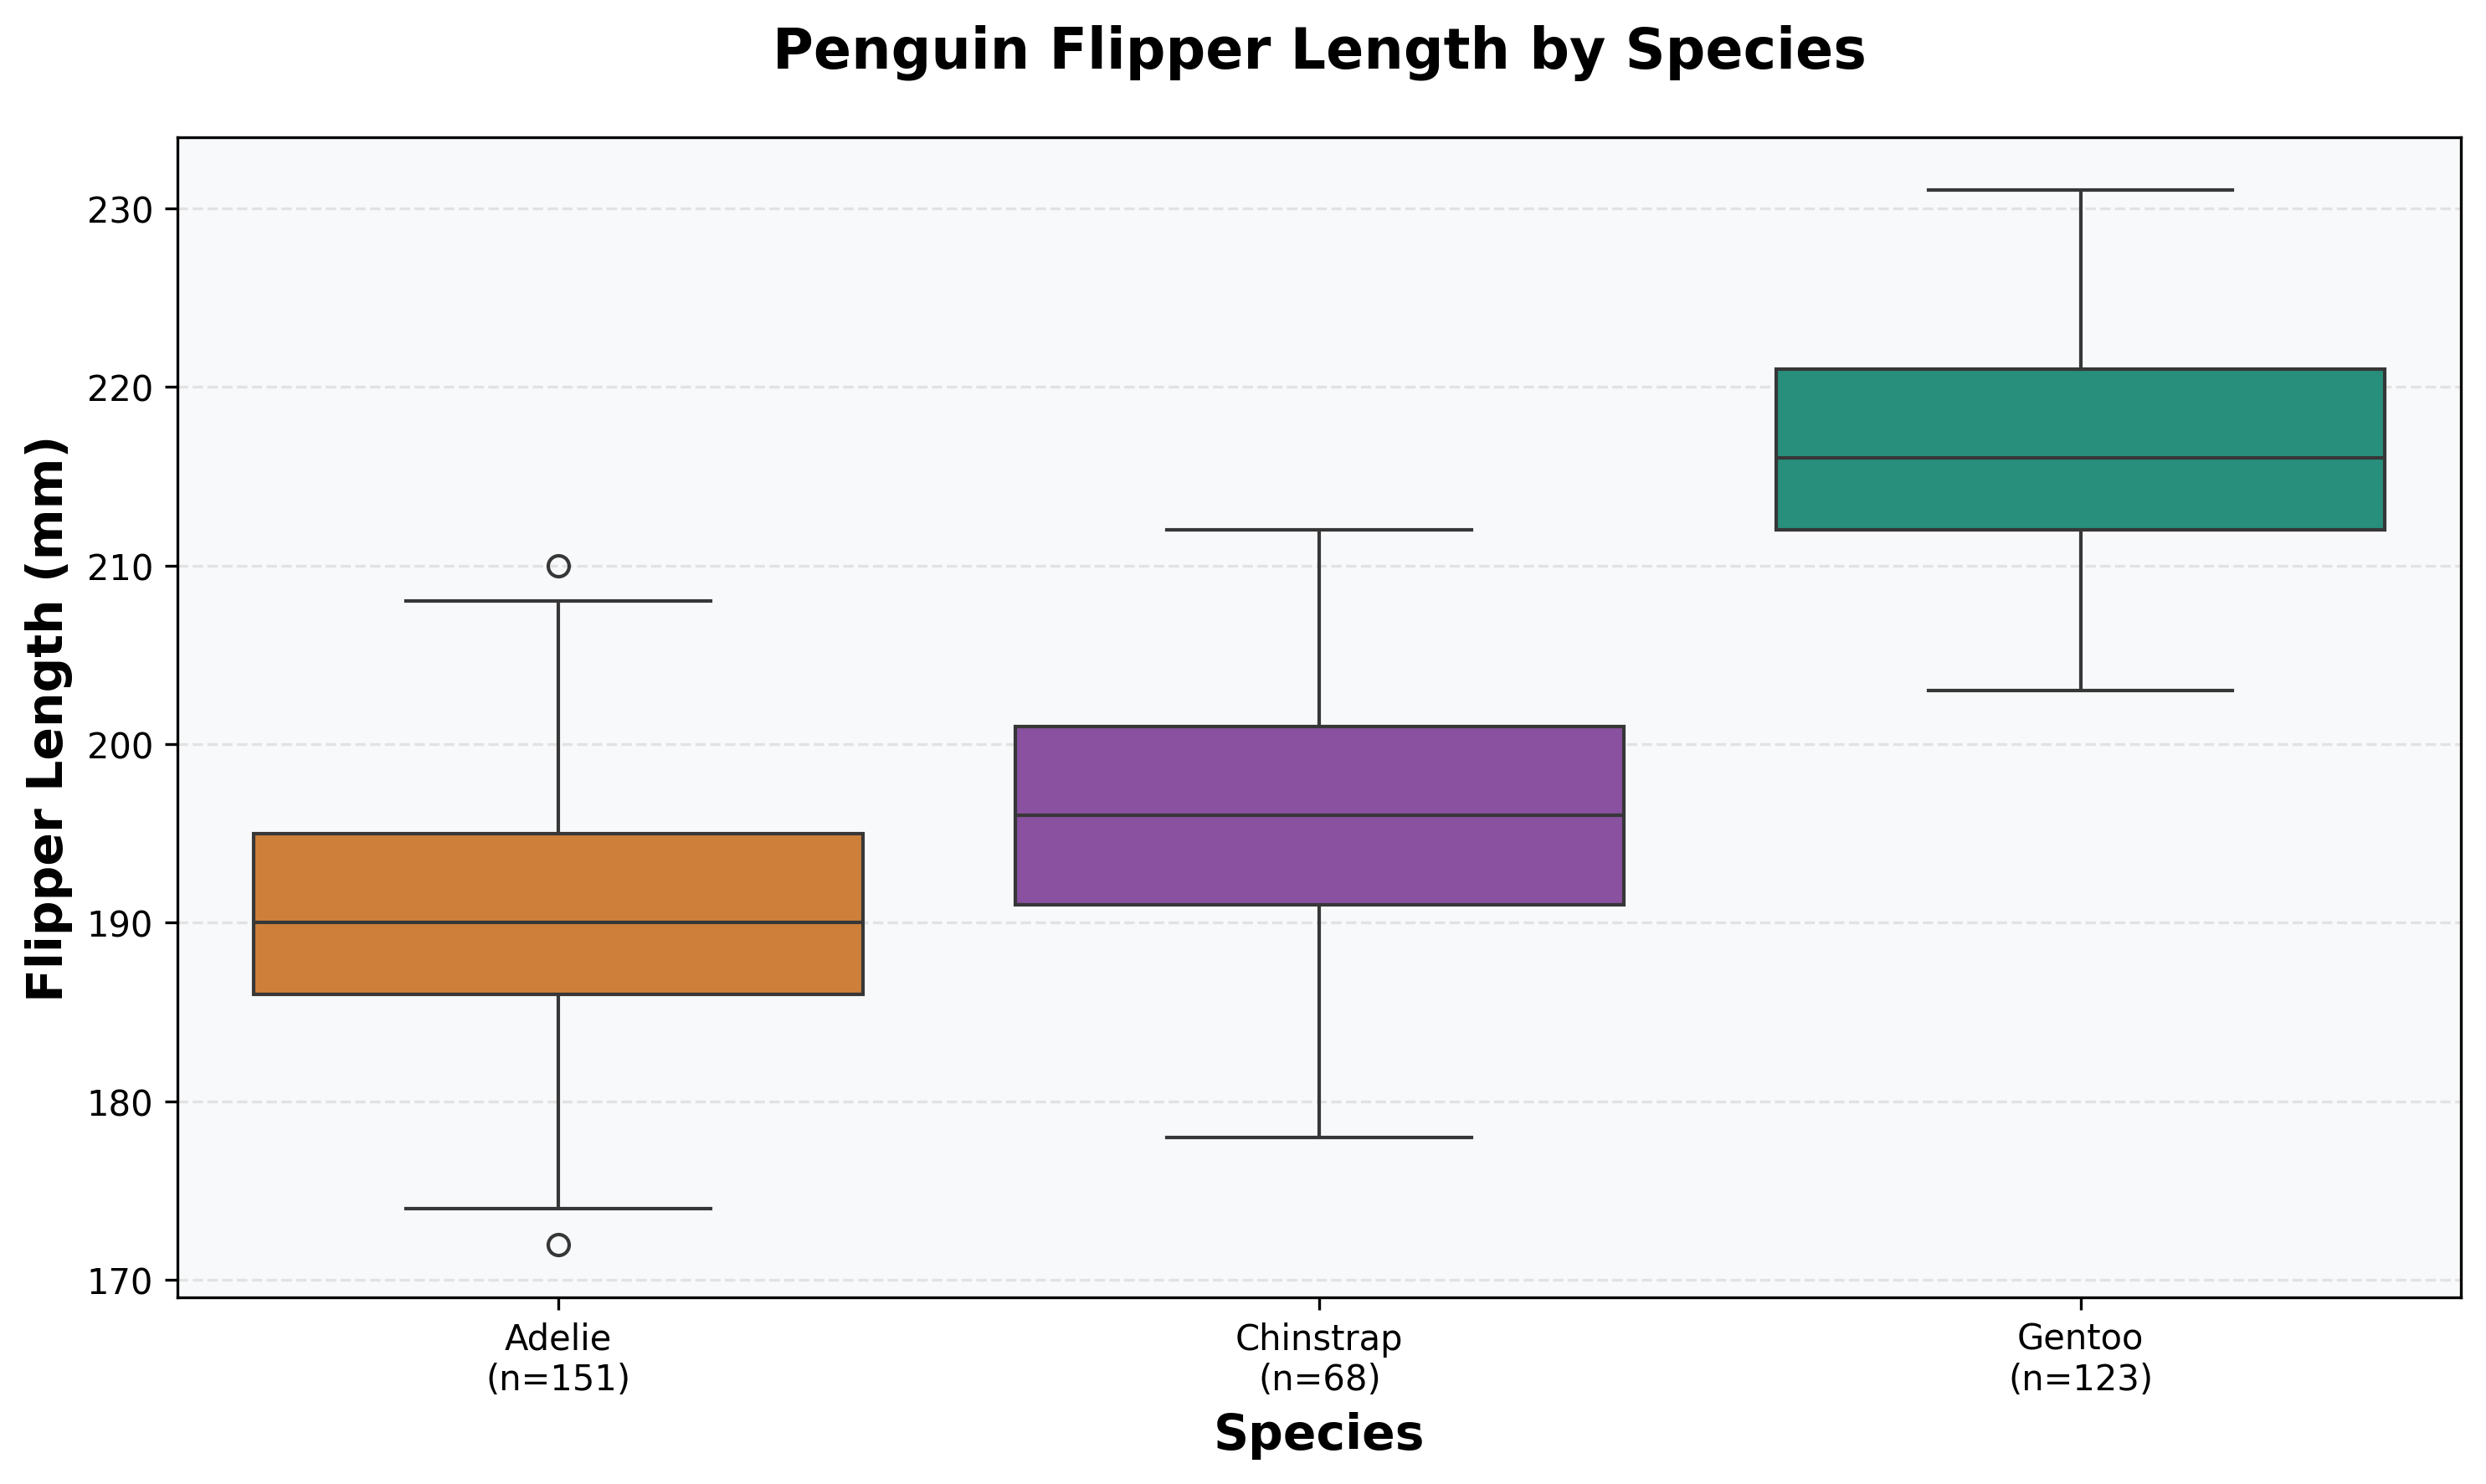
What patterns do you notice?
Bar Plot: Species Count
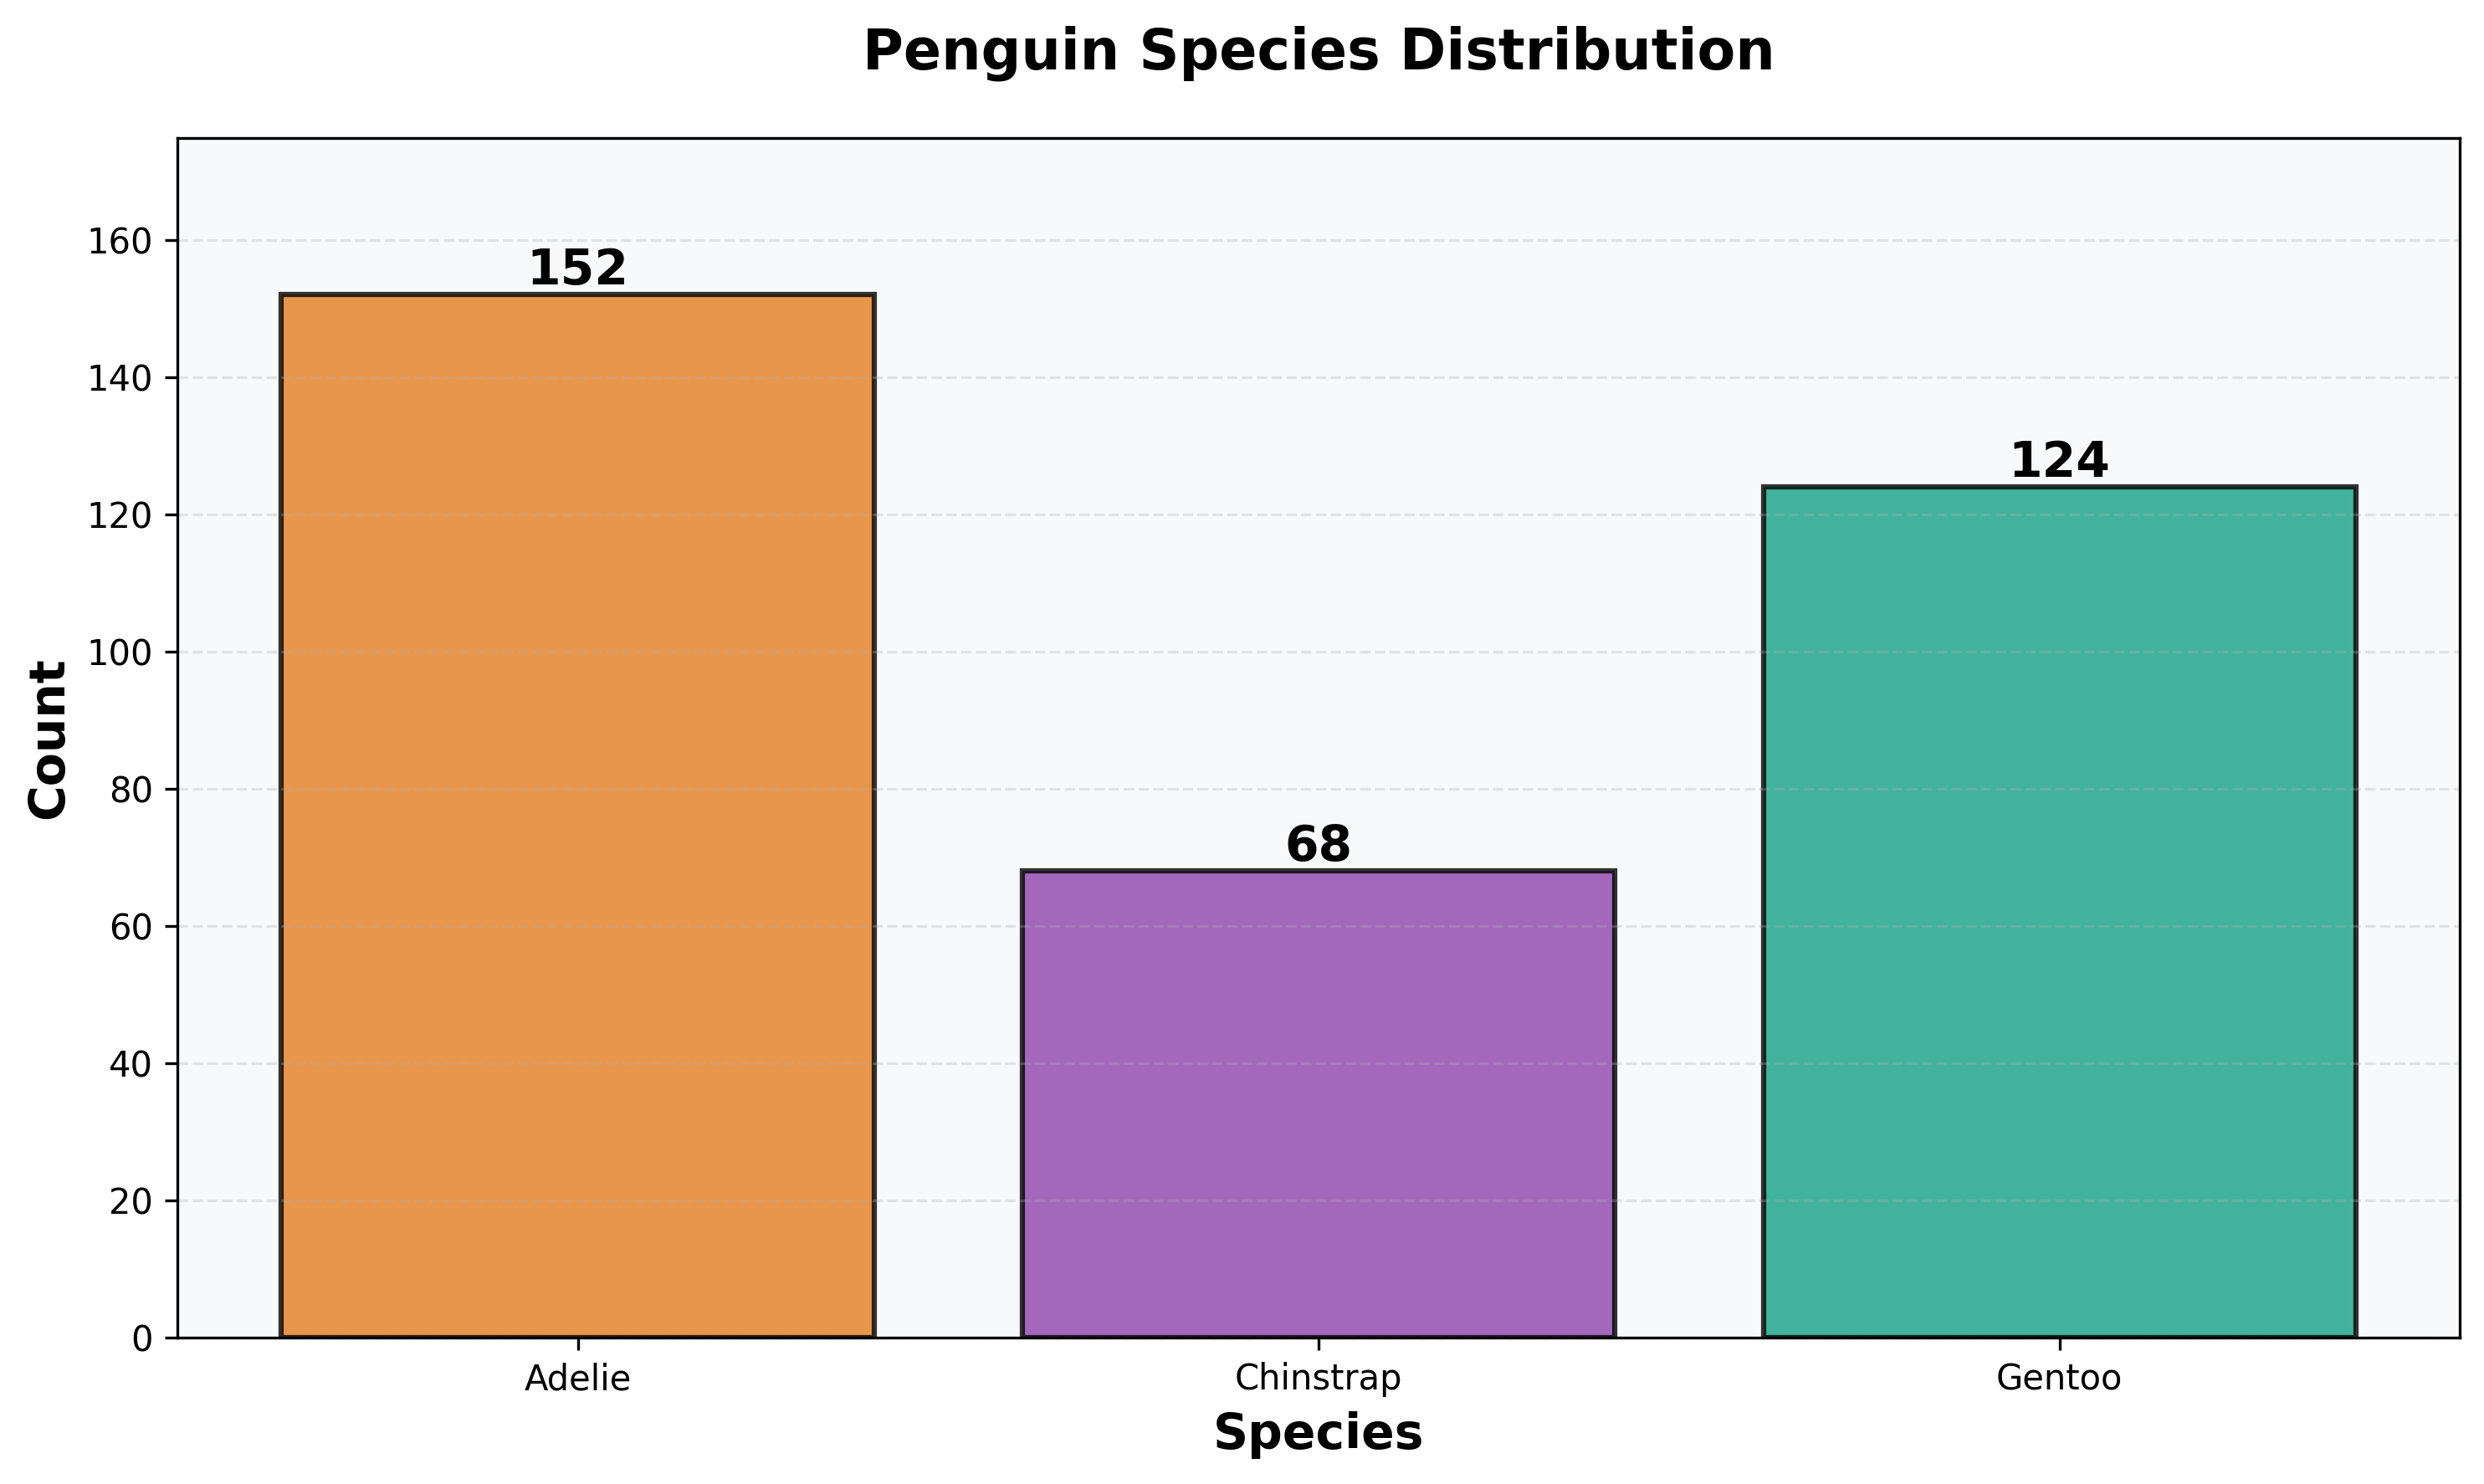
How many species are present, and how many individuals belong to each species?
Pie Chart: Species Proportion
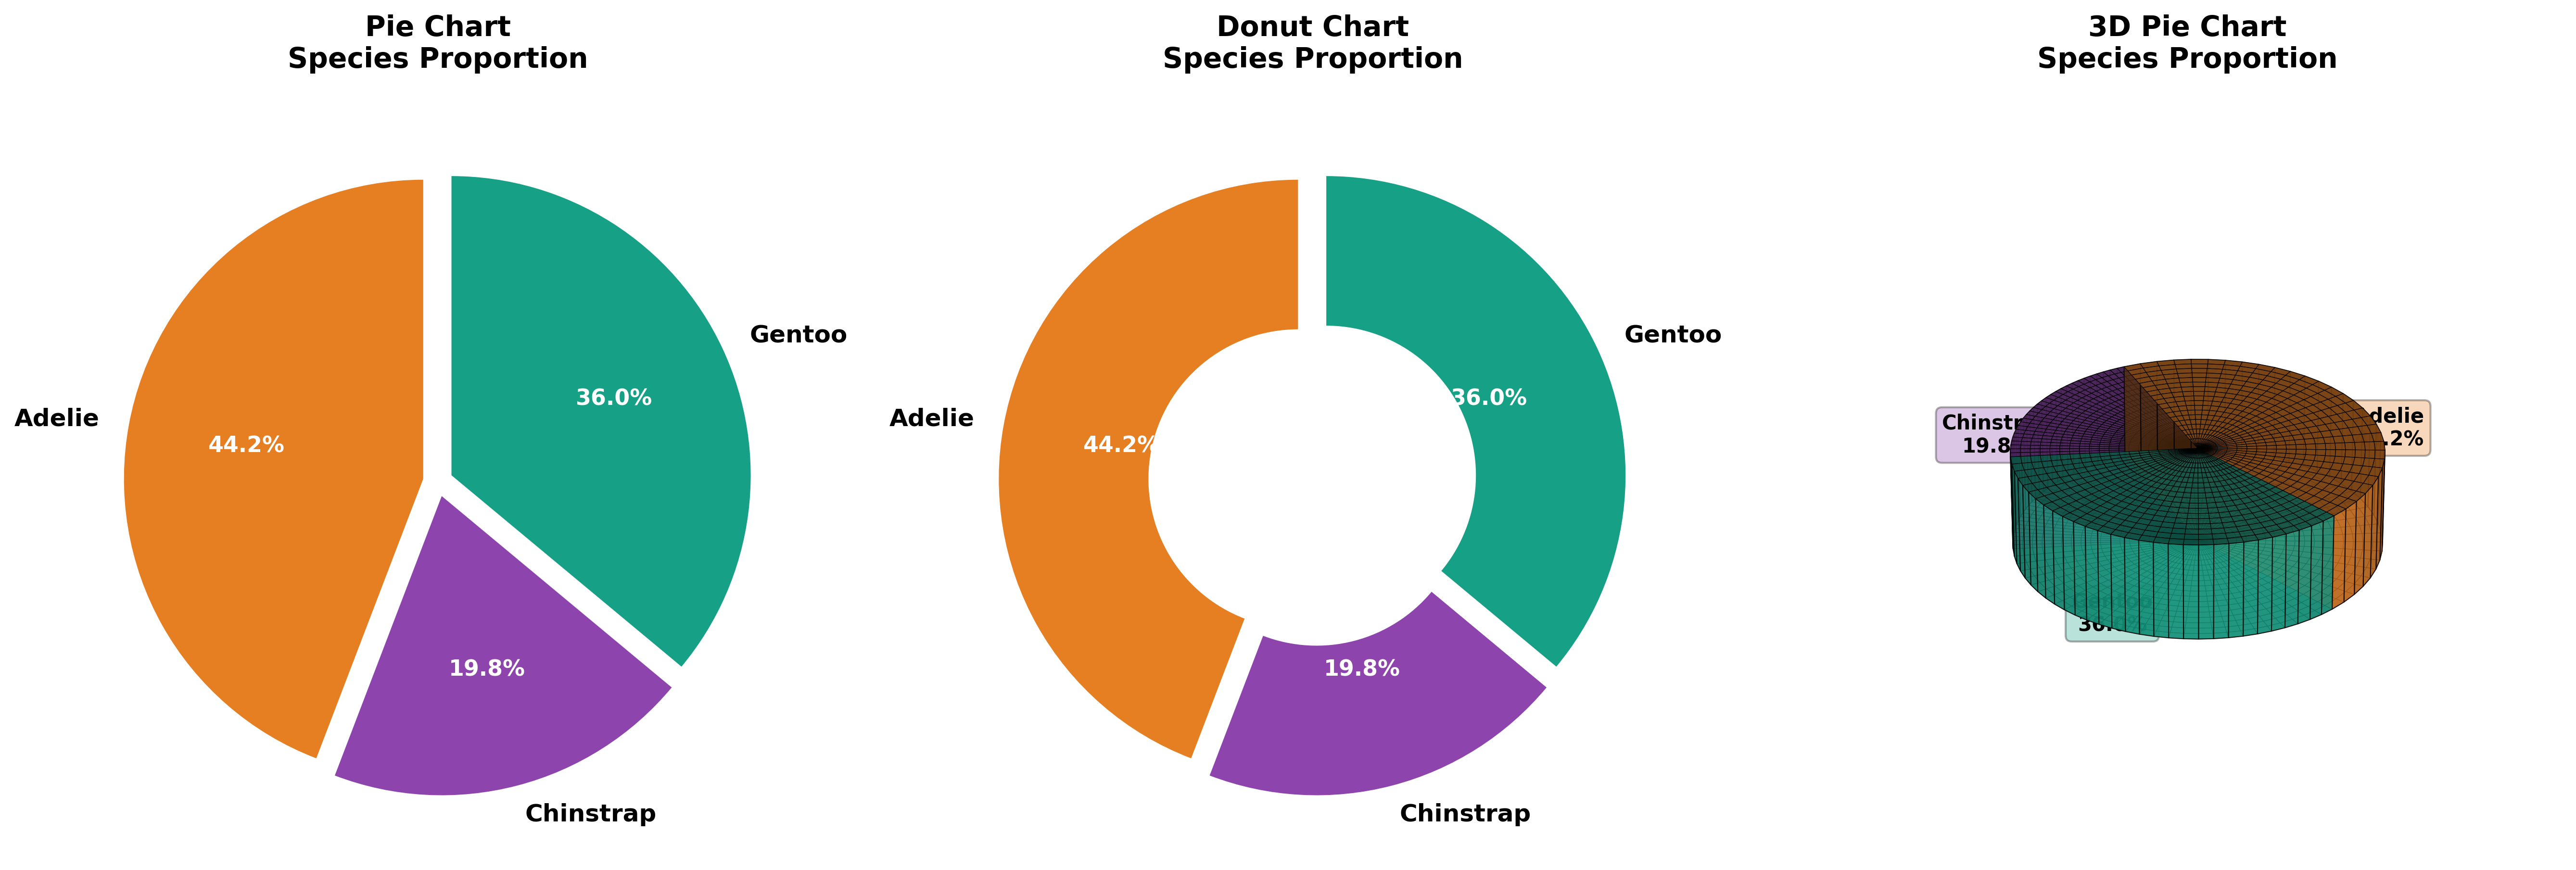
Discussion
What are the limitations of pie charts? When might a bar plot be better?
Break Time! ☕ 5-minute break
Stretch, grab water, chat with neighbors!
We’ll resume with types of variables and data collection.
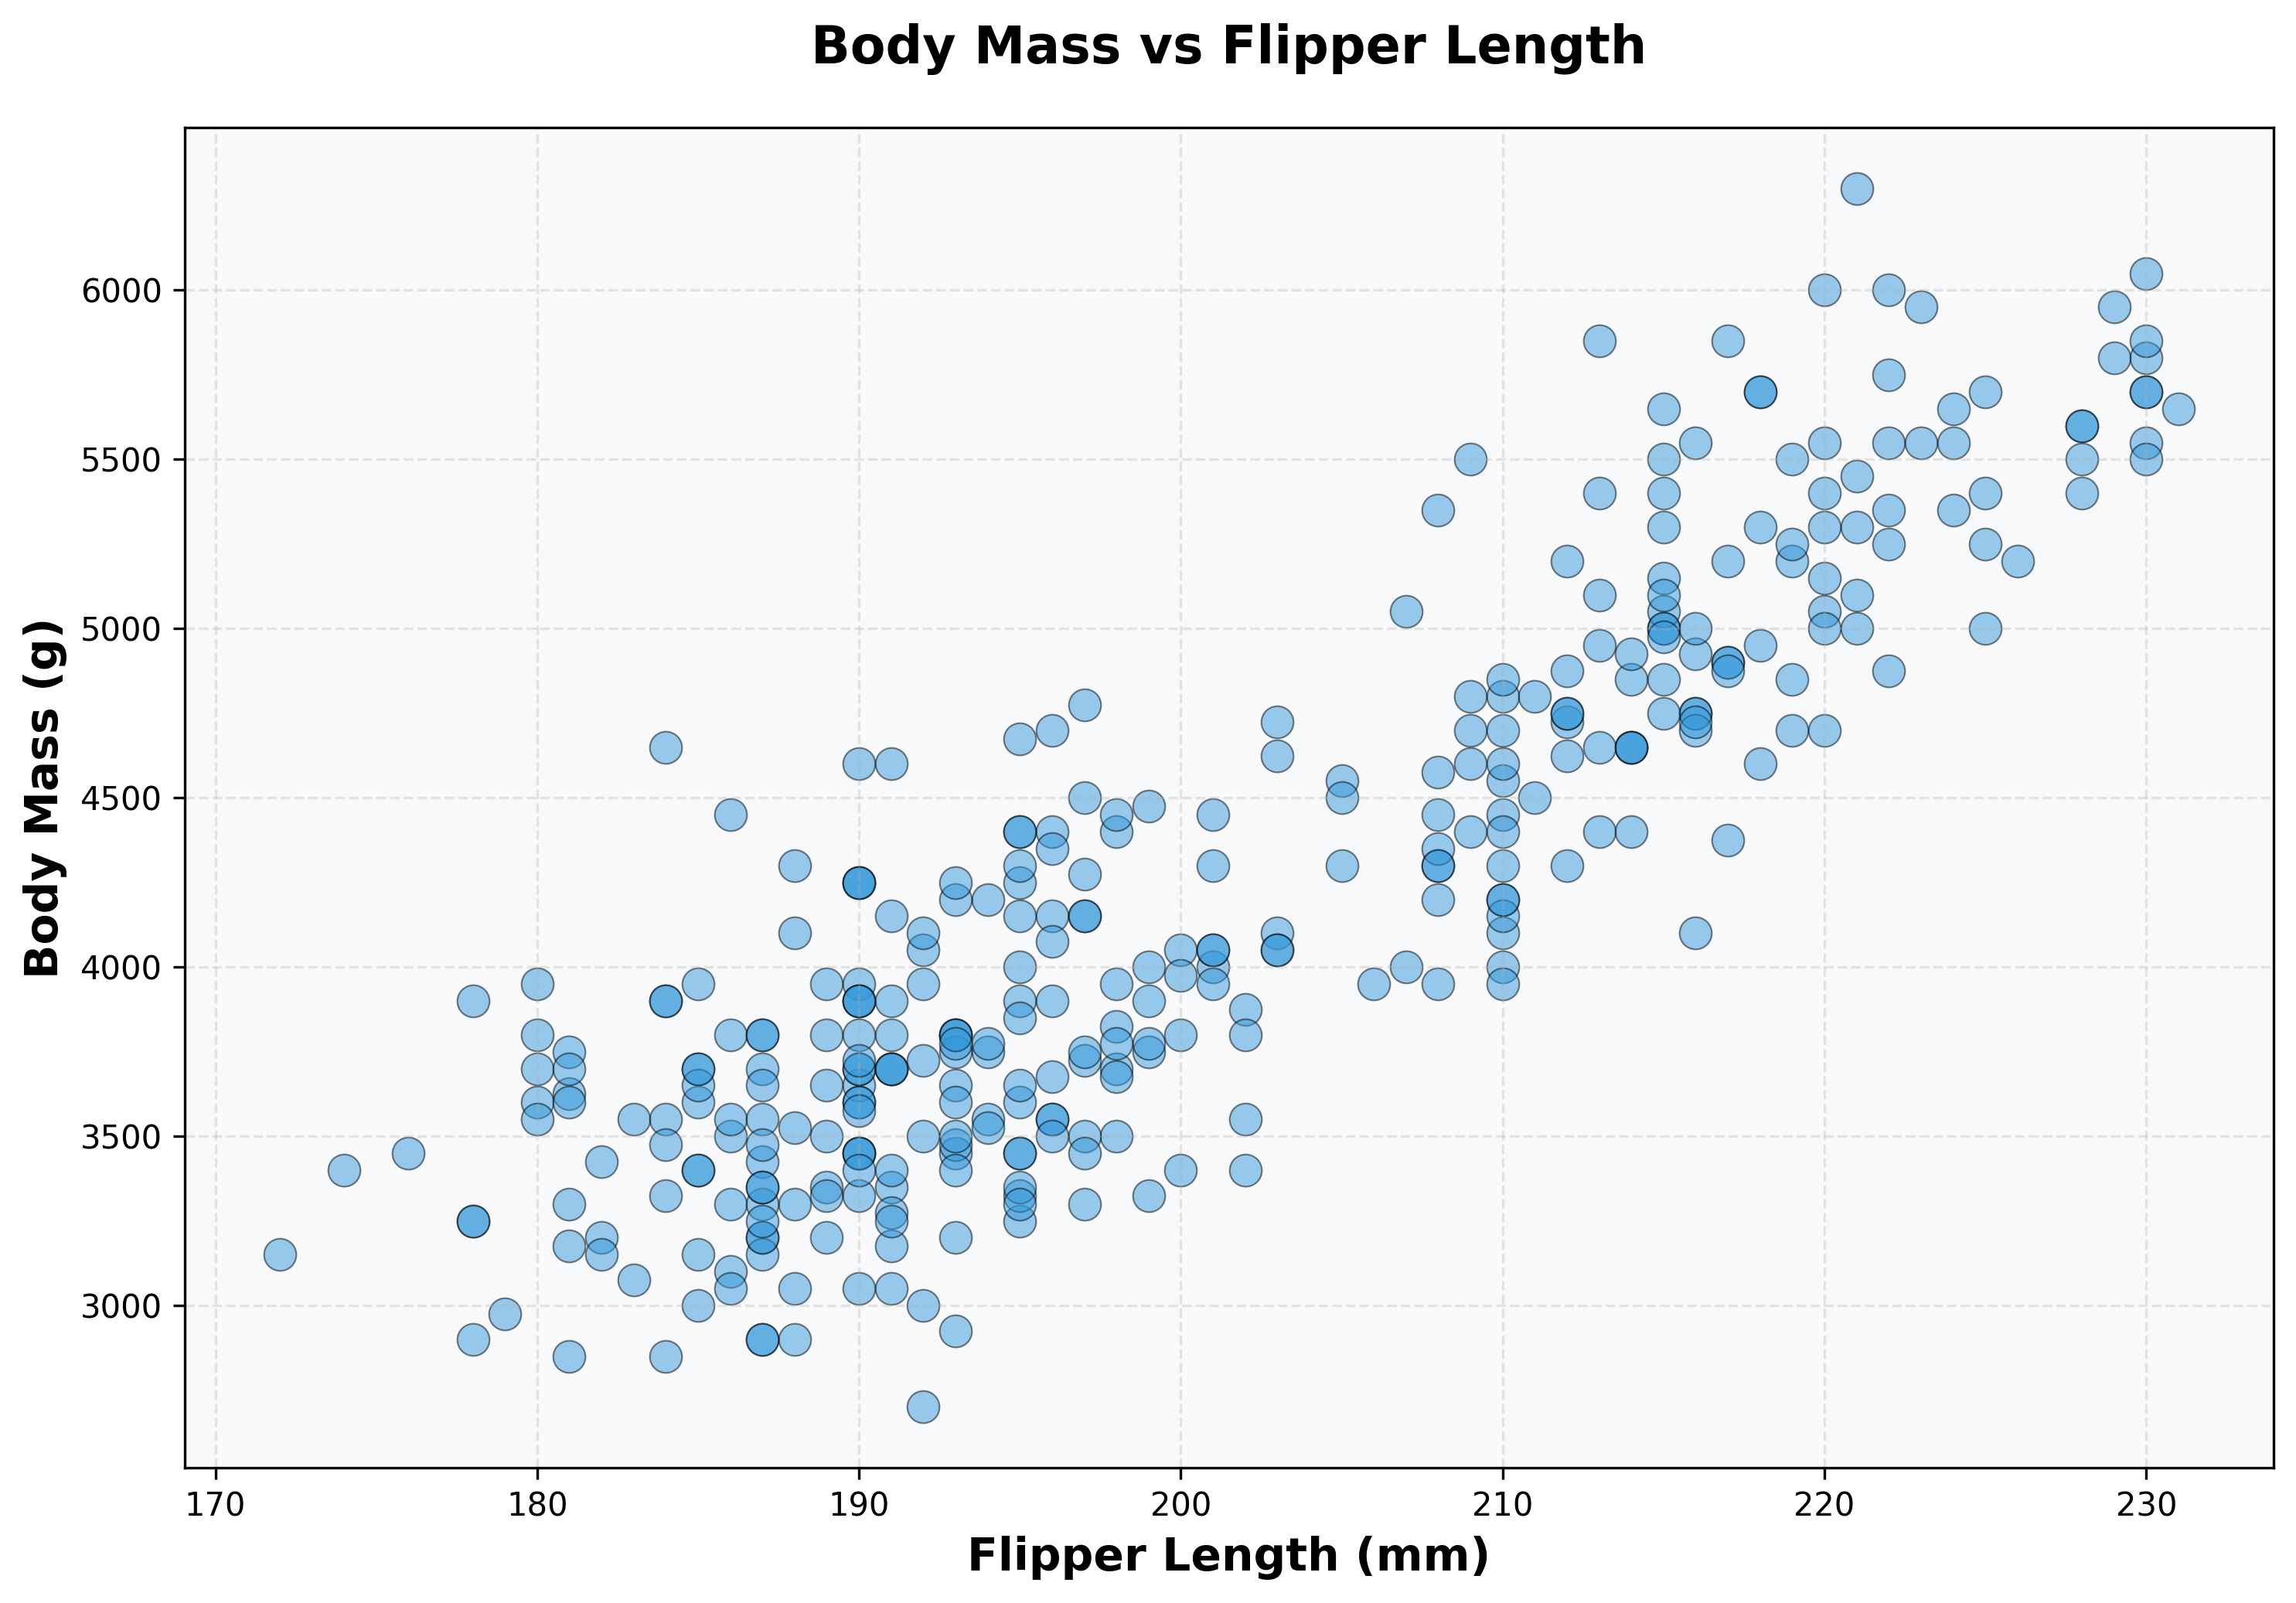
Scatterplot: Body Mass vs Flipper Length
Scatterplot by Species
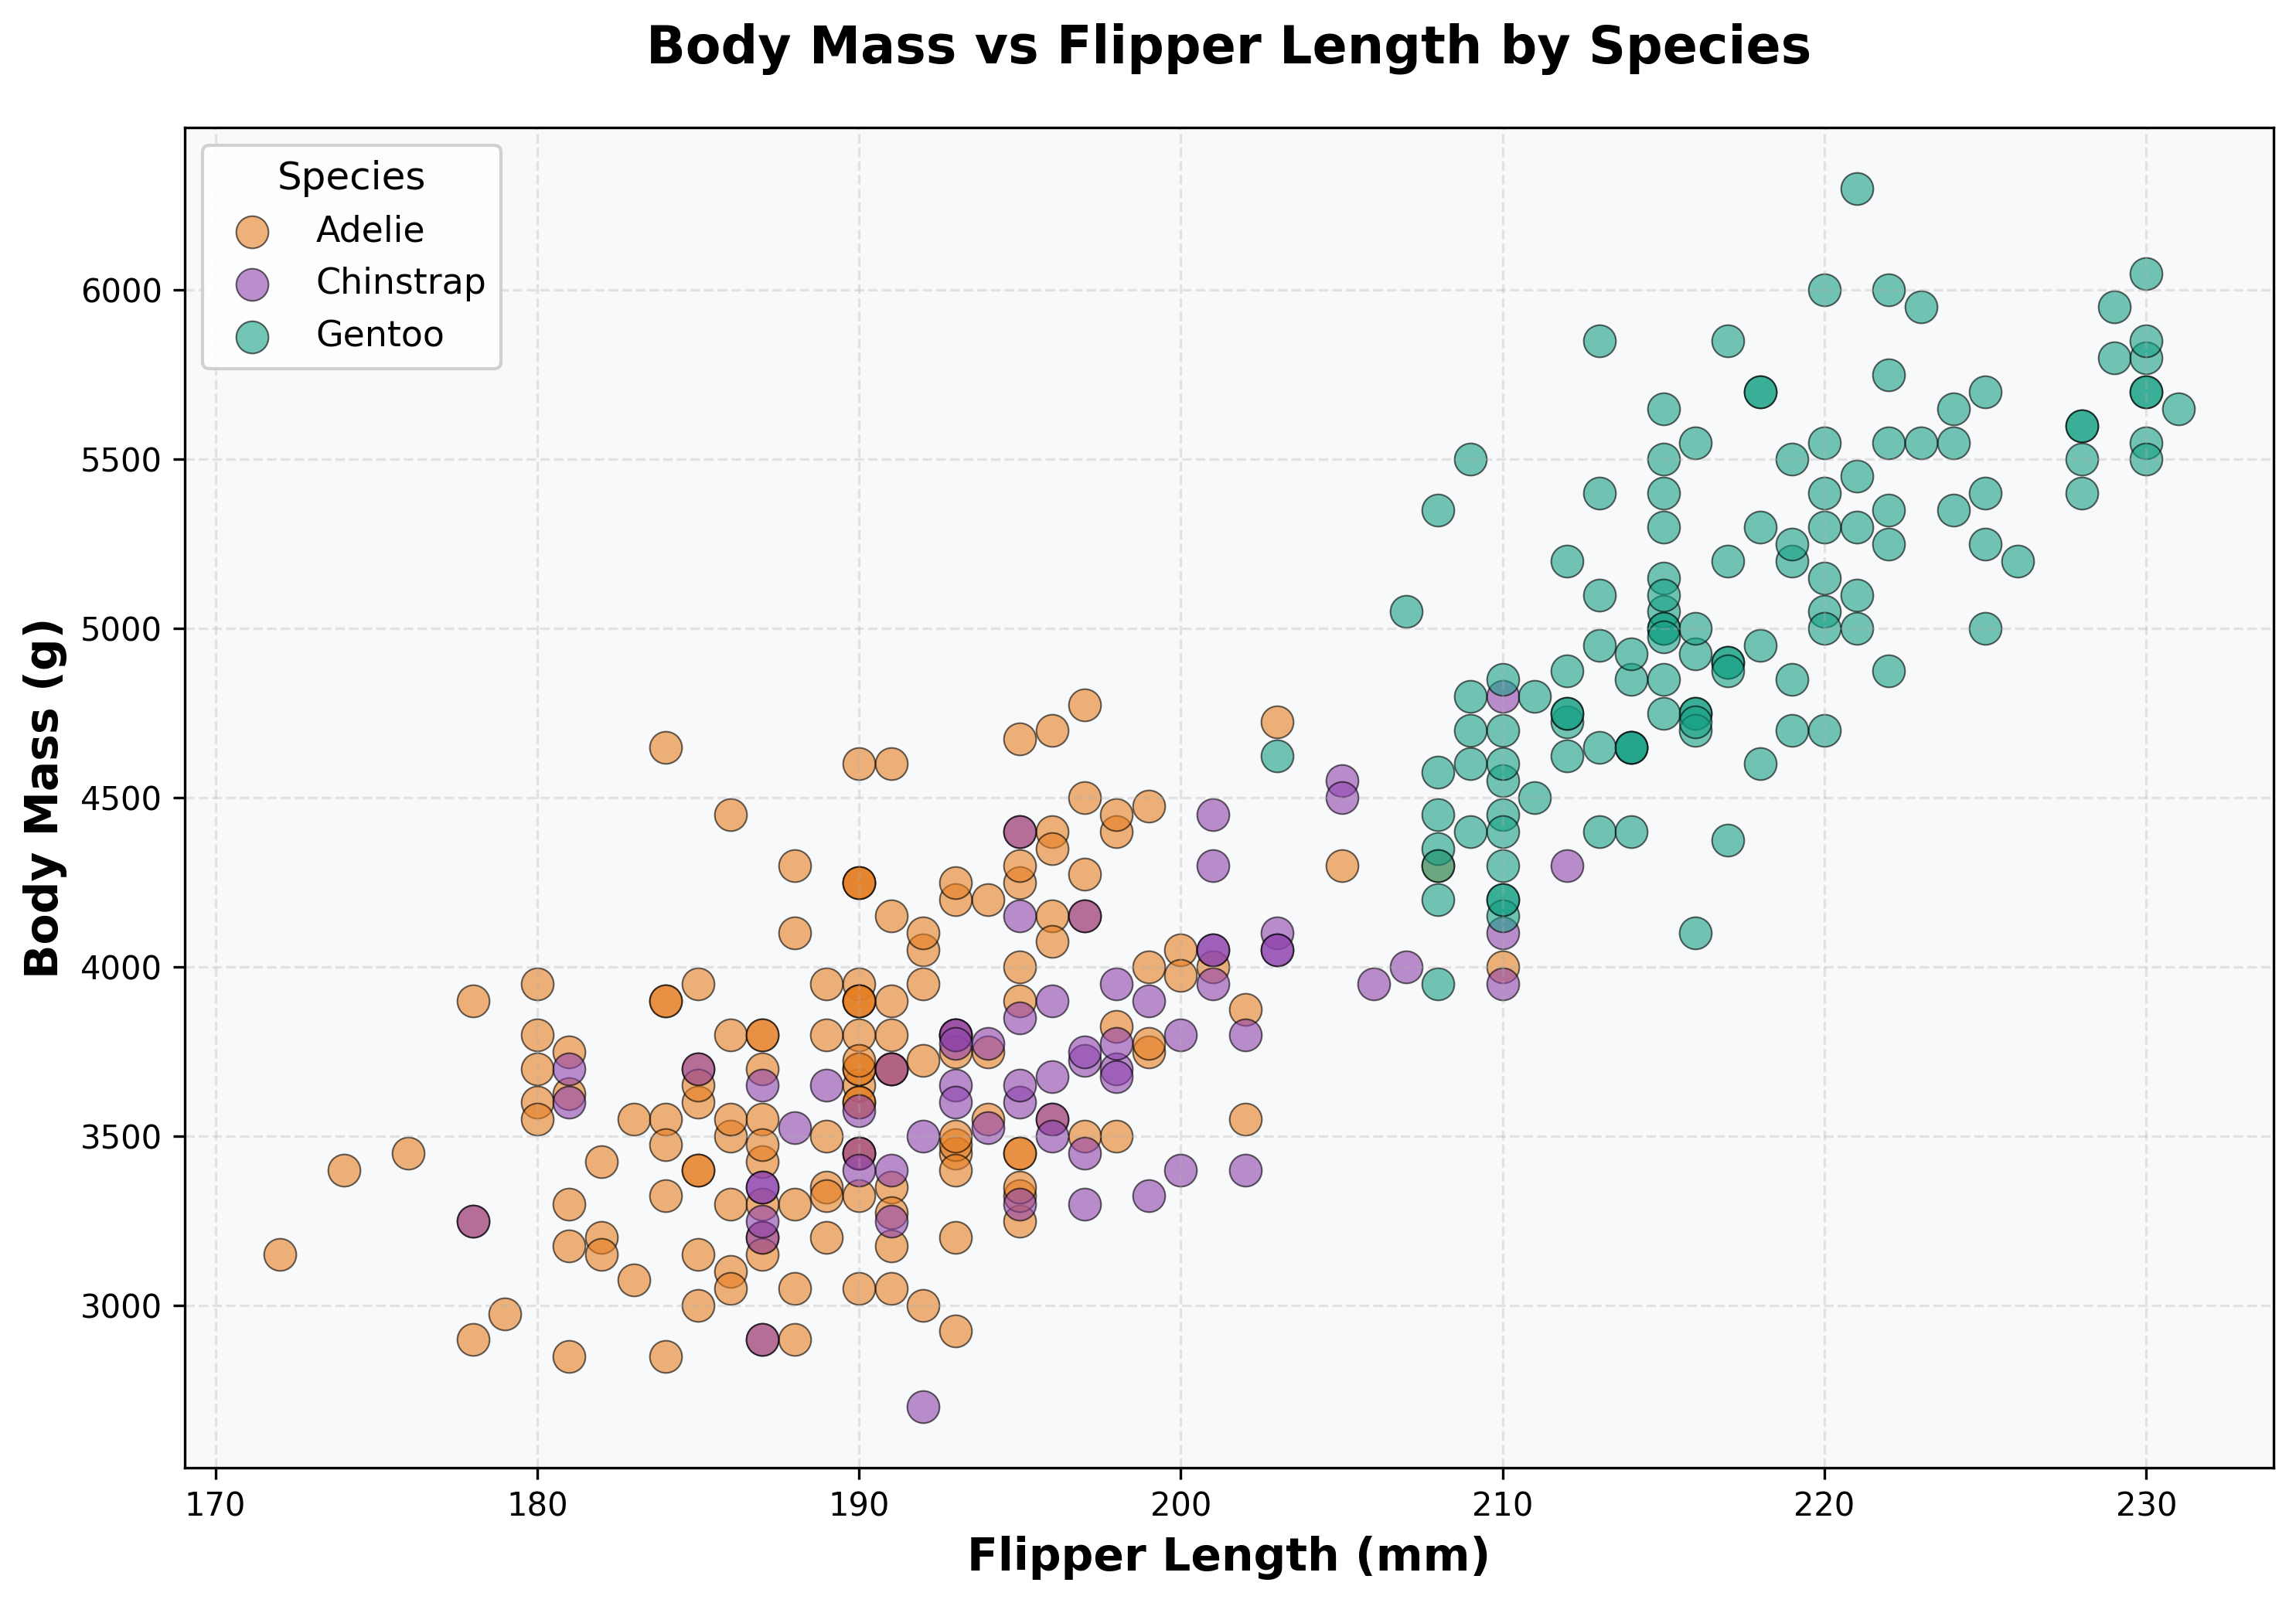
What patterns emerge when we add species information?
Interpreting Correlation
Interactive practice: https://istats.shinyapps.io/guesscorr/
Correlation Patterns

Warning
Correlation only measures linear relationships!
Scatterplot for Example
What correlation do you expect?
Scatterplot for Example: Body Mass vs Flipper Length
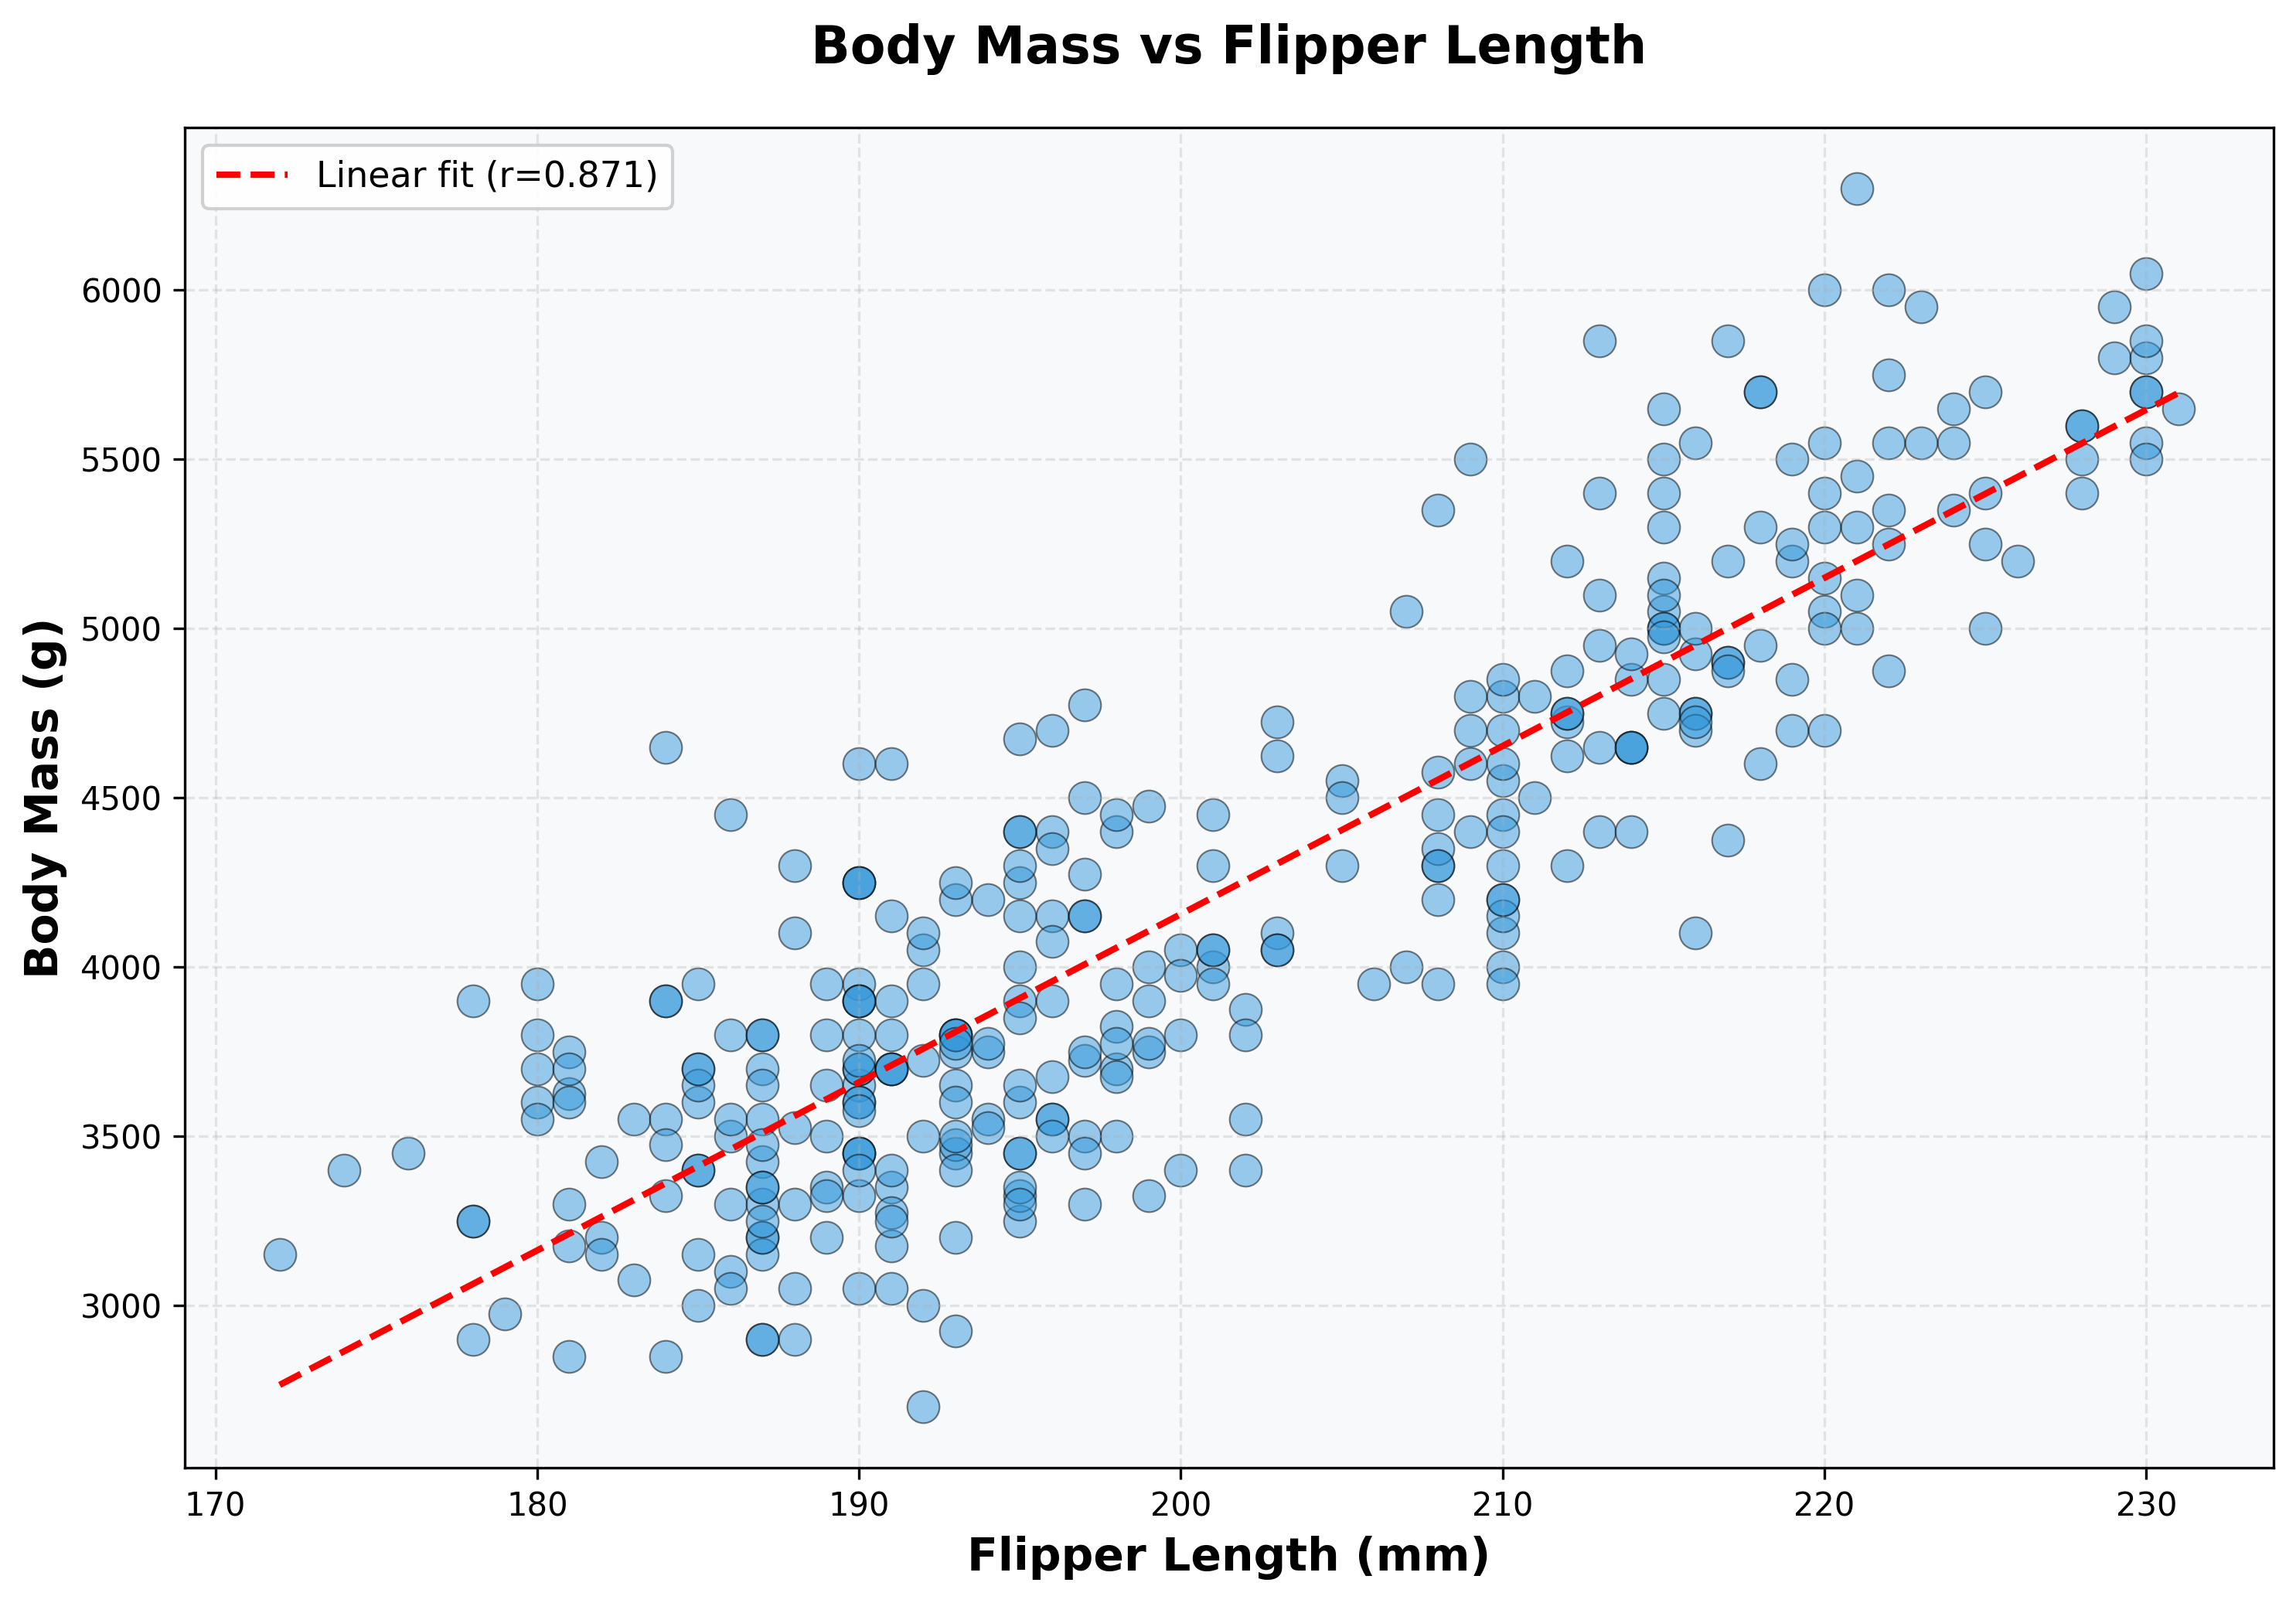
Calculated correlation: r ≈ 0.87
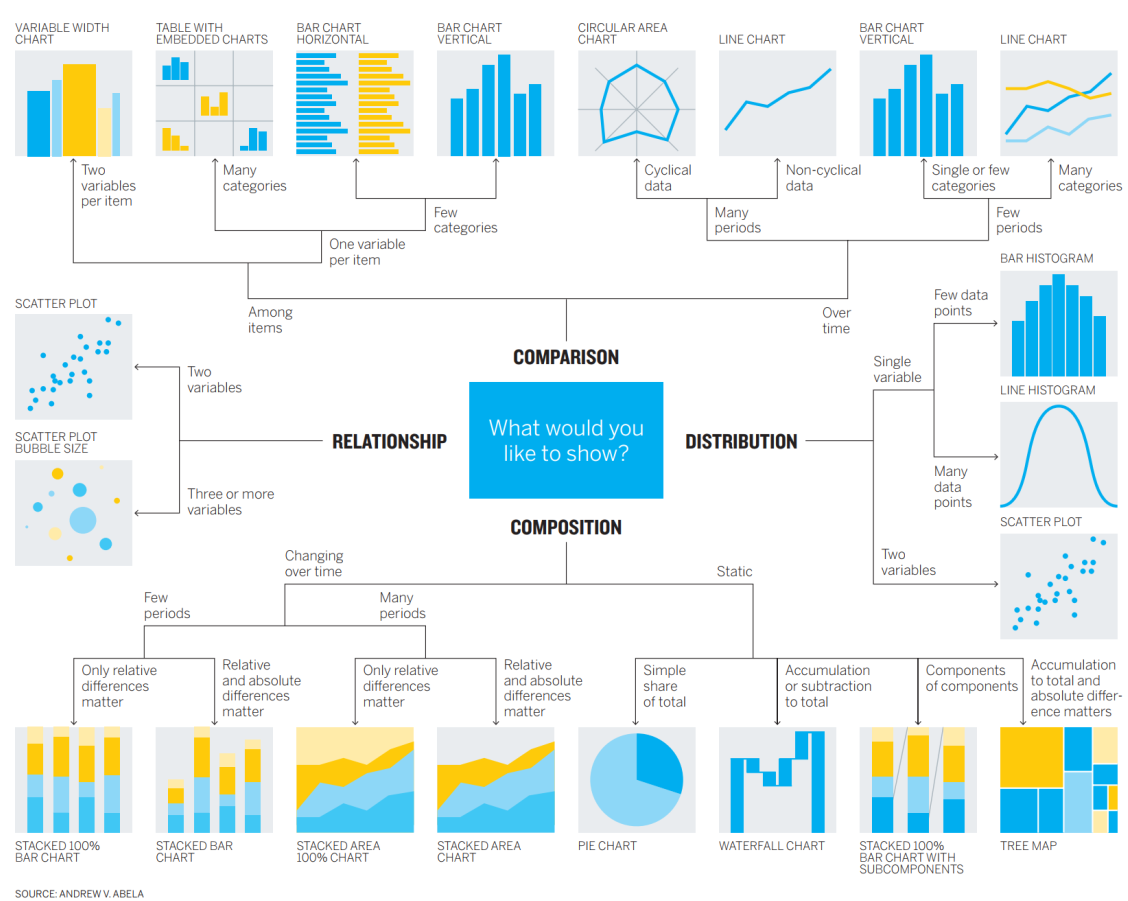
Summary: How to choose?