Lecture 3: Study Design & Data Summarization
STAT 7 - Statistical Methods for the Biological, Environmental & Health Sciences
10 Mar 2026
Case Study: Preventing Peanut Allergies
The Problem:
- Peanut allergies in children were increasing dramatically
- Traditional advice: avoid peanuts in early childhood. But was this advice actually helping?
The Study: LEAP (06-09)
- 640 UK infants with eczema or egg allergy
- Randomly assigned to two groups:
- Peanut consumption group
- Peanut avoidance group
- 2006-2009

Key Question: Does early peanut consumption prevent allergies?
Poll Question
Activity: Redesigning the LEAP Study
Poll: PollEv.com/slugstats

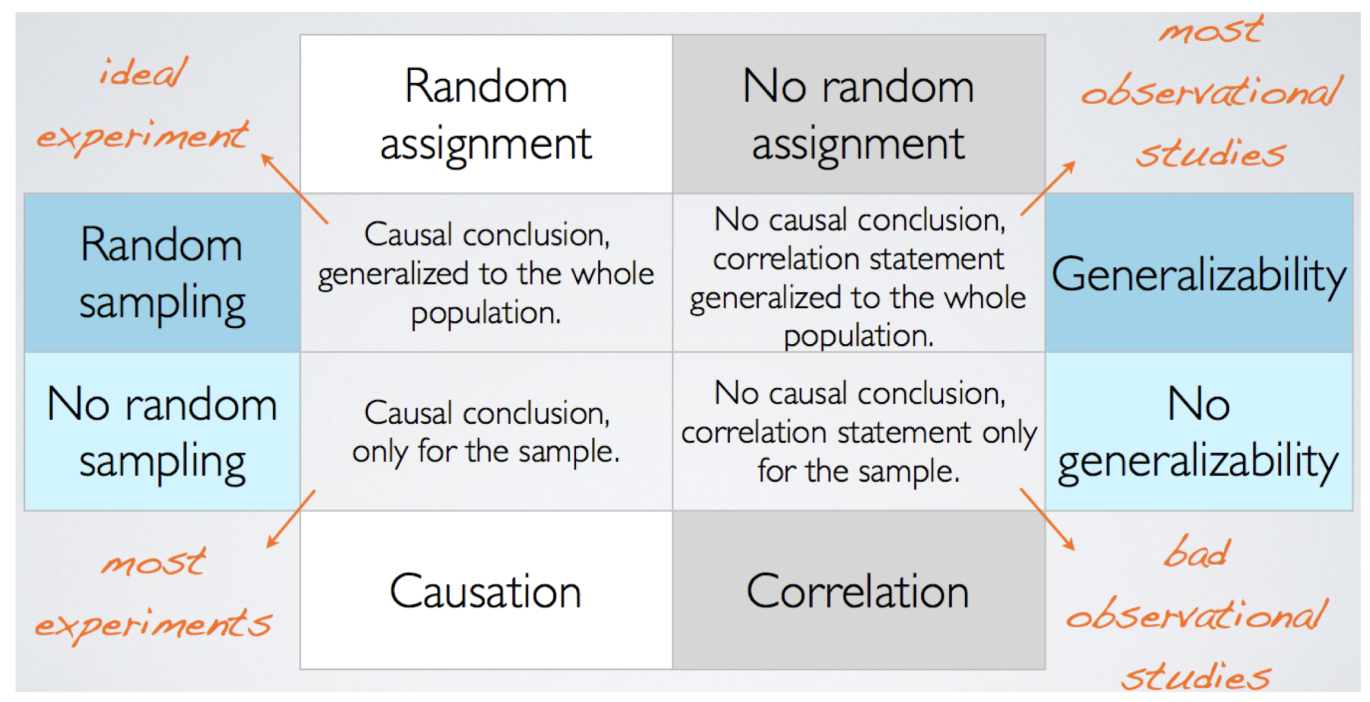
Summary
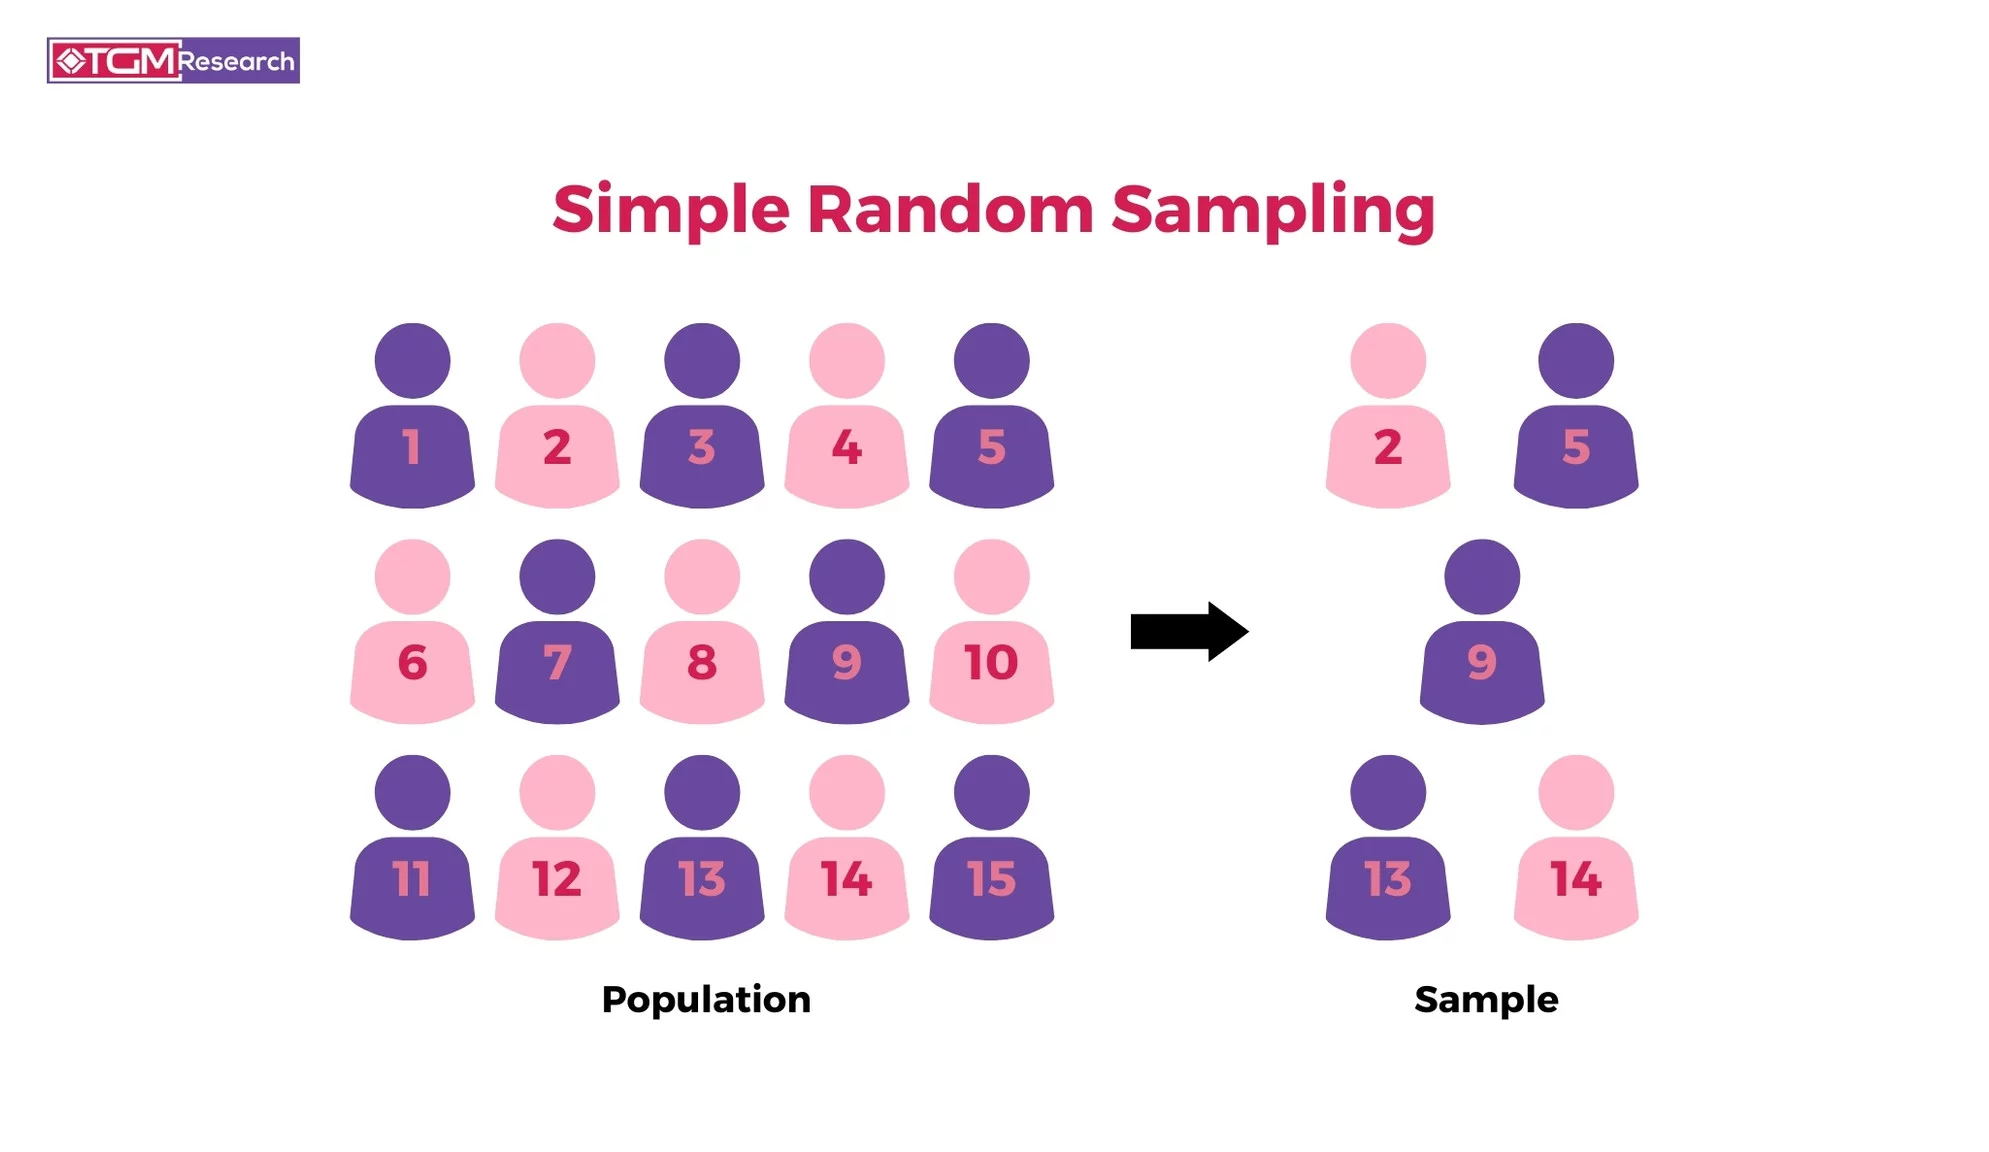
Simple Random Sample
Randomly select cases from the population
- No implied connection between selected points
- Every member has equal probability of selection
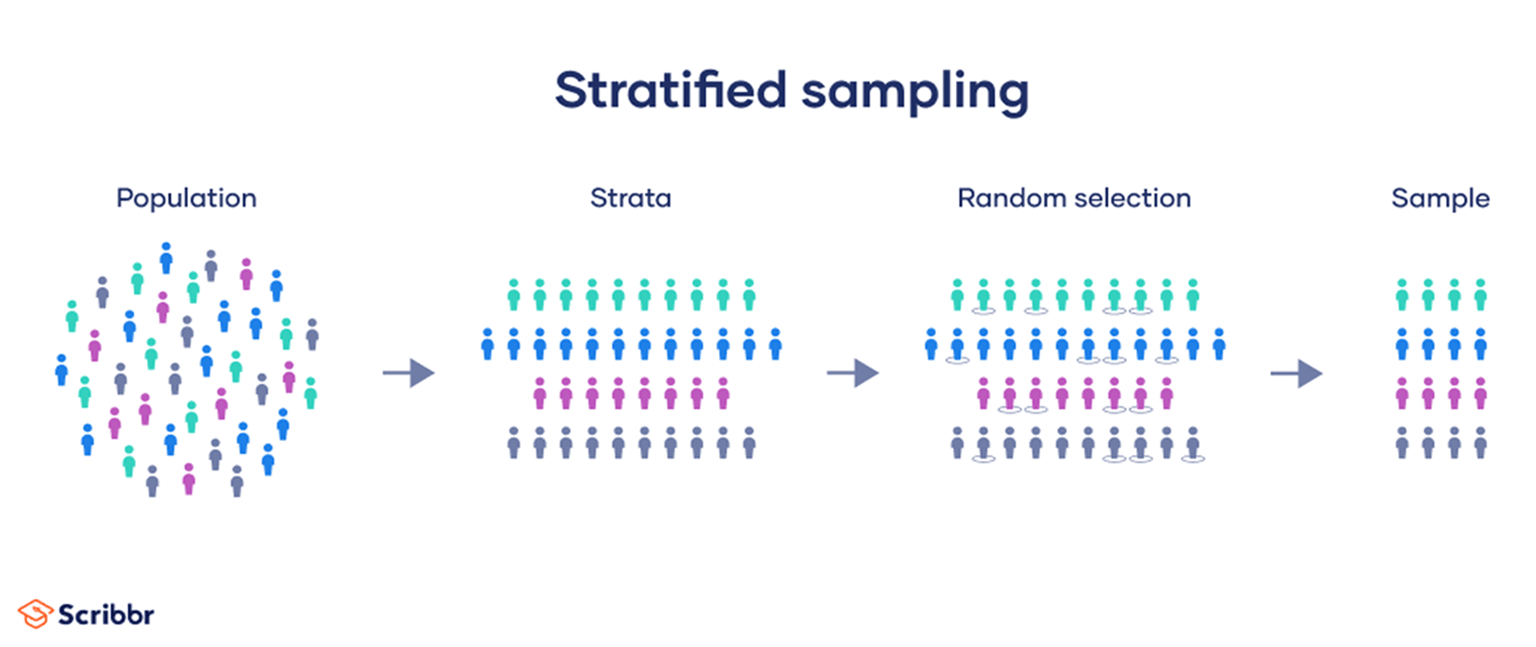
Stratified Sample
Strata are made up of similar observations
- Take a simple random sample from each stratum
- Ensures representation from each subgroup
Cluster Sample
Clusters are usually NOT homogeneous
- Take a simple random sample of clusters
- Sample ALL observations in selected clusters
- Usually preferred for economical reasons

Multistage Sample
Combination approach
- Take a simple random sample of clusters
- Then take a simple random sample of observations from selected clusters

Activity: Air Pollution Study Design
Your Task
Which sampling method would you choose?
A. Random Sampling across entire region
B. Stratified Sampling (proportional to each zone)
C. Cluster Sampling (select neighborhoods, measure all locations)
Poll: PollEv.com/slugstats
Break Time! ☕ 5-minute break
Stretch, grab water, chat with neighbors!
We’ll resume with types of variables and data collection.

Should We Calculate by Hand?
Yes, for learning:
- Understand the process
- Check computer output
- Debug code
- Build intuition
No, for research:
- Avoid calculation errors
- Improve efficiency
- Enable reproducibility
- Allow others to verify

Correlation (Preview)
We’ll explore this more next time, but here’s a preview:

Interactive tool: https://istats.shinyapps.io/guesscorr/