| participant.ID | treatment.group | overall.V60.outcome |
|---|---|---|
| LEAP_100522 | Peanut Consumption | PASS OFC |
| LEAP_103358 | Peanut Consumption | PASS OFC |
| LEAP_105069 | Peanut Avoidance | PASS OFC |
| LEAP_994047 | Peanut Avoidance | PASS OFC |
| LEAP_997608 | Peanut Consumption | PASS OFC |
Lecture 2: Data Collection and Statistical Thinking
STAT 7 - Statistical Methods for the Biological, Environmental & Health Sciences
09 Jan 2026
Case Study: Preventing Peanut Allergies
The Problem:
- Peanut allergies in children were increasing dramatically
- Traditional advice: avoid peanuts in early childhood. But was this advice actually helping?
The Study: LEAP (06-09)
- 640 UK infants with eczema or egg allergy
- Randomly assigned to two groups:
- Peanut consumption group
- Peanut avoidance group
- Tested at age 5 with oral food challenge
Key Question: Does early peanut consumption prevent allergies?
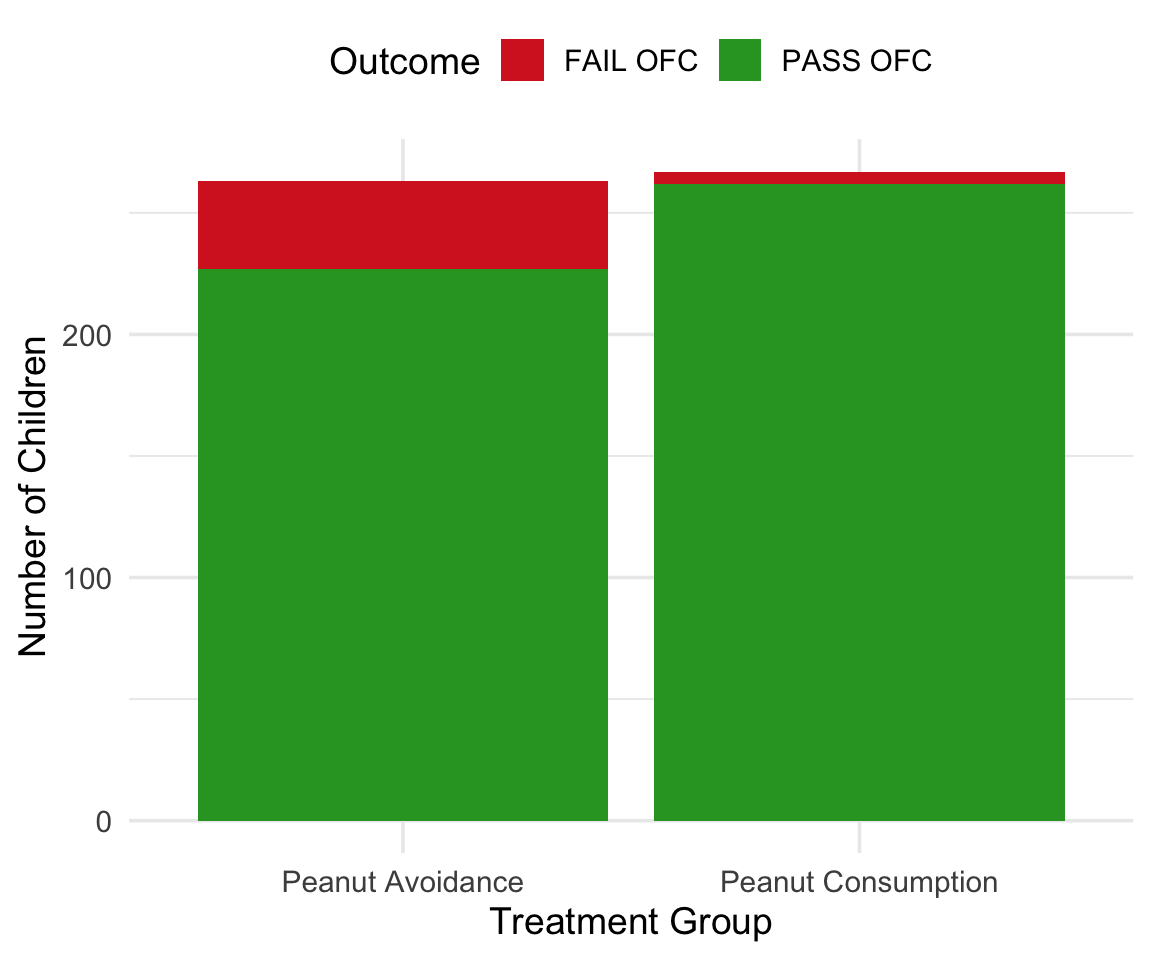
The Data: Summarized
Summary Table
| FAIL OFC | PASS OFC | Total | |
|---|---|---|---|
| Peanut Avoidance | 36 | 227 | 263 |
| Peanut Consumption | 5 | 262 | 267 |
| Total | 41 | 489 | 530 |
- Avoidance: 36/263 = 13.7% failed
- Consumption: 5/267 = 1.9% failed
- Difference: 11.8%
Visual Summary
Think-Pair-Share: Belief Bias

PollEv.com/slugstats
The Statistical Investigation Cycle
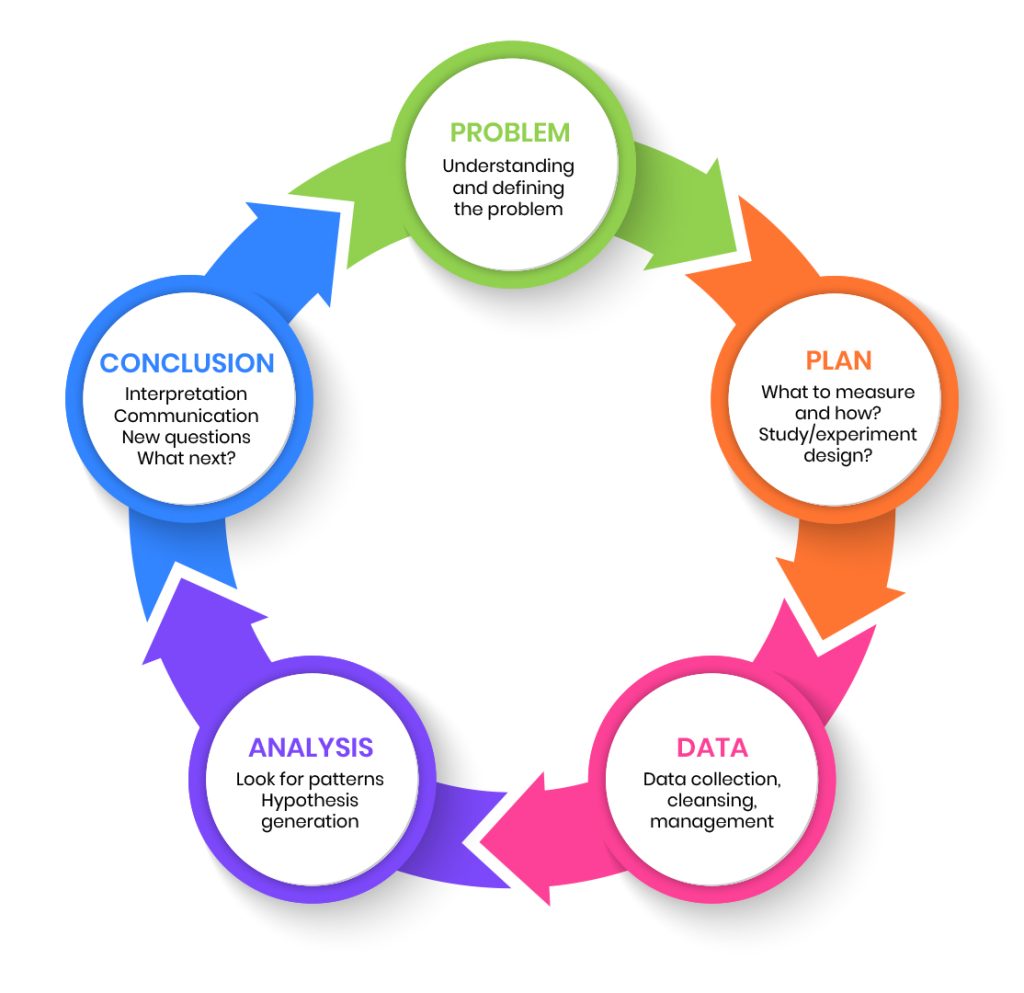
PPDAC: Problem → Plan → Data → Analysis → Conclusion
Every statistical study follows this cycle!
From Chris Wild: What is Statistics?
Visualizing Population vs. Sample
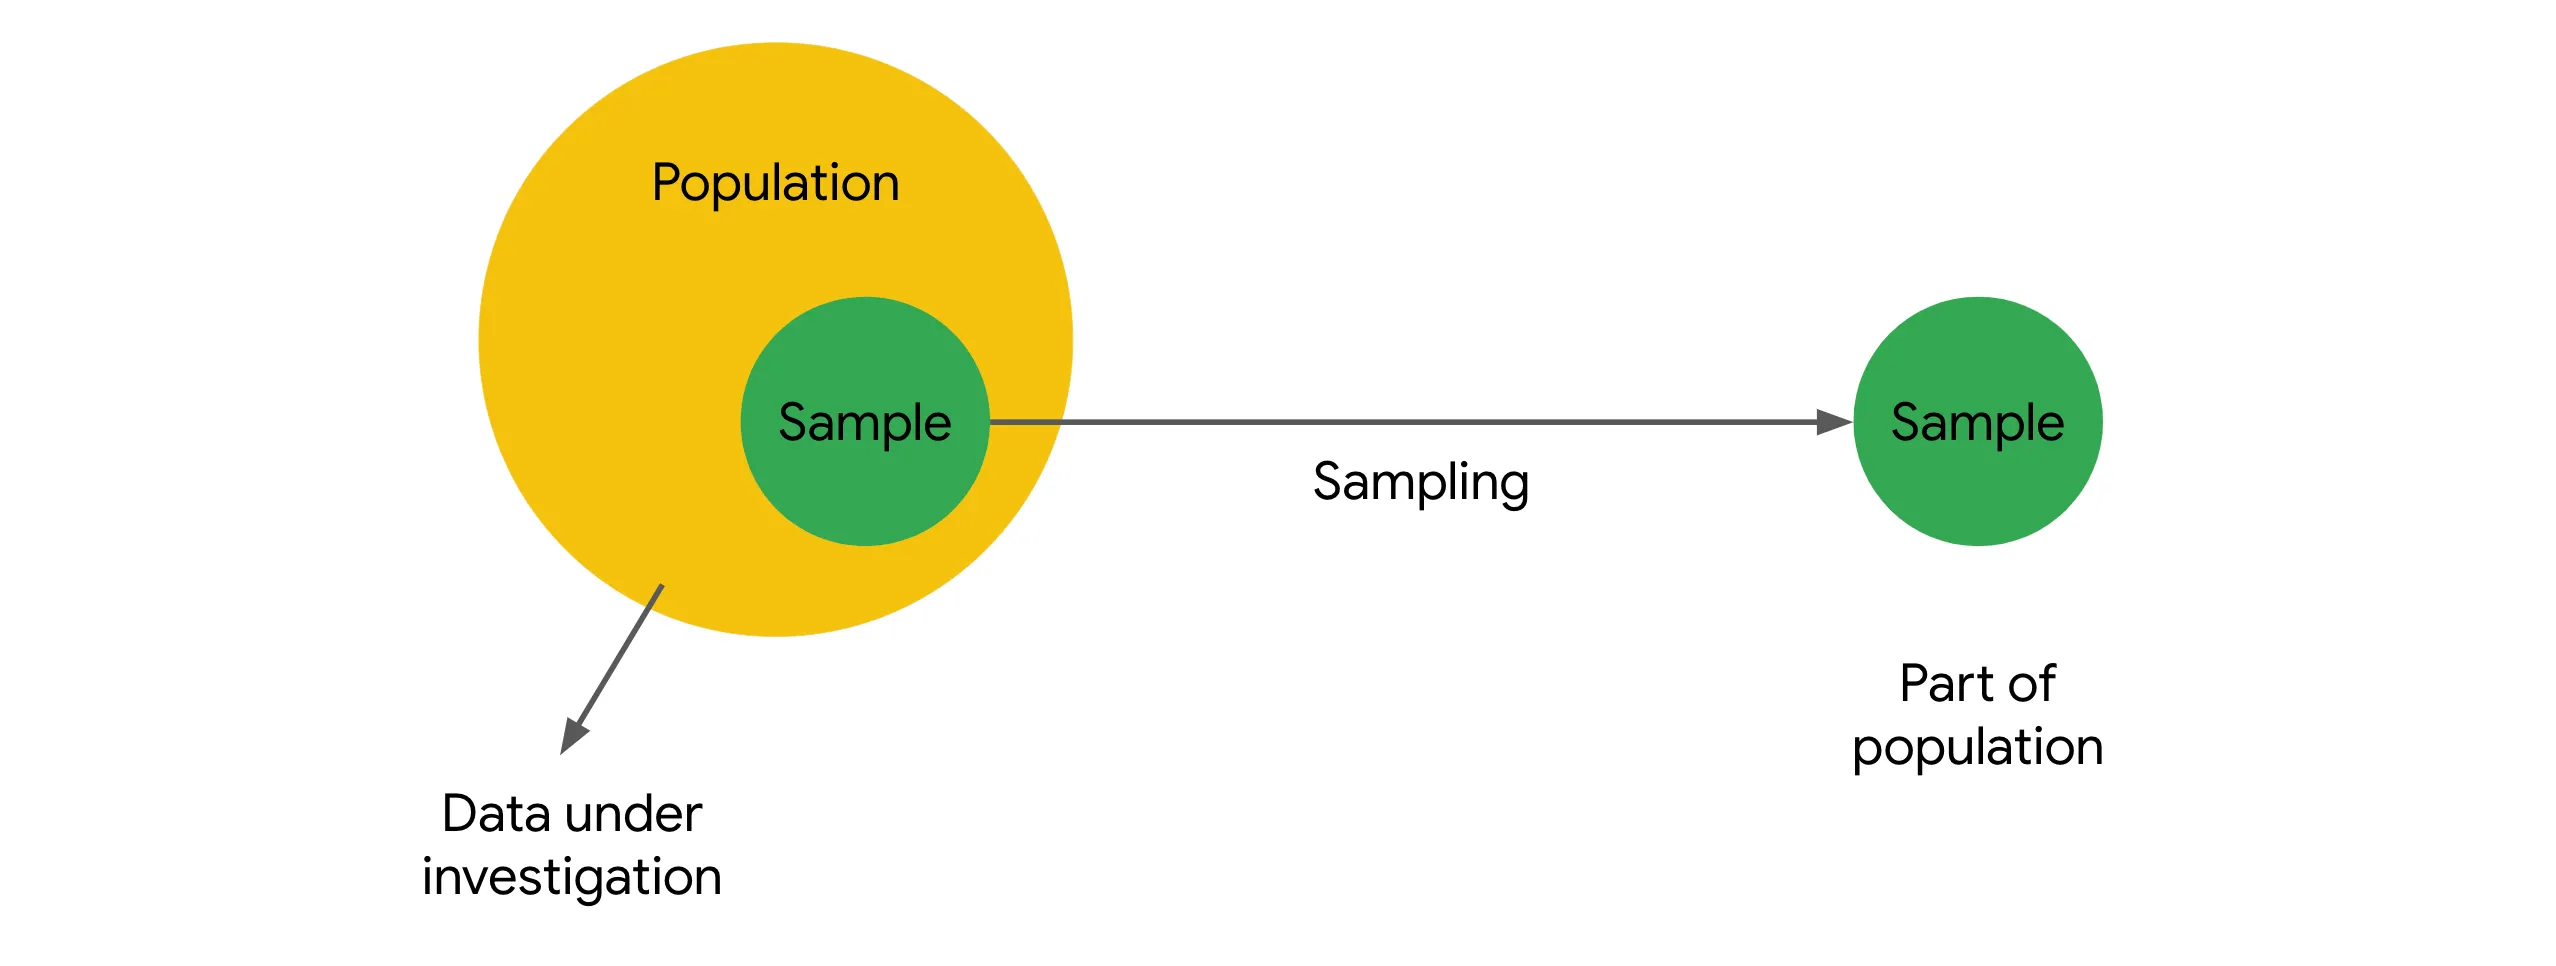
Population
All units of interest (often unobserved)
Sample
Observed units (subset we measure)
Key insight: We use the sample (what we can observe) to learn about the population (what we want to know about)
Poll Everywhere: Identify the Components
For the LEAP peanut allergy study, identify each component:
Visual Guide to Categorical Variable Types
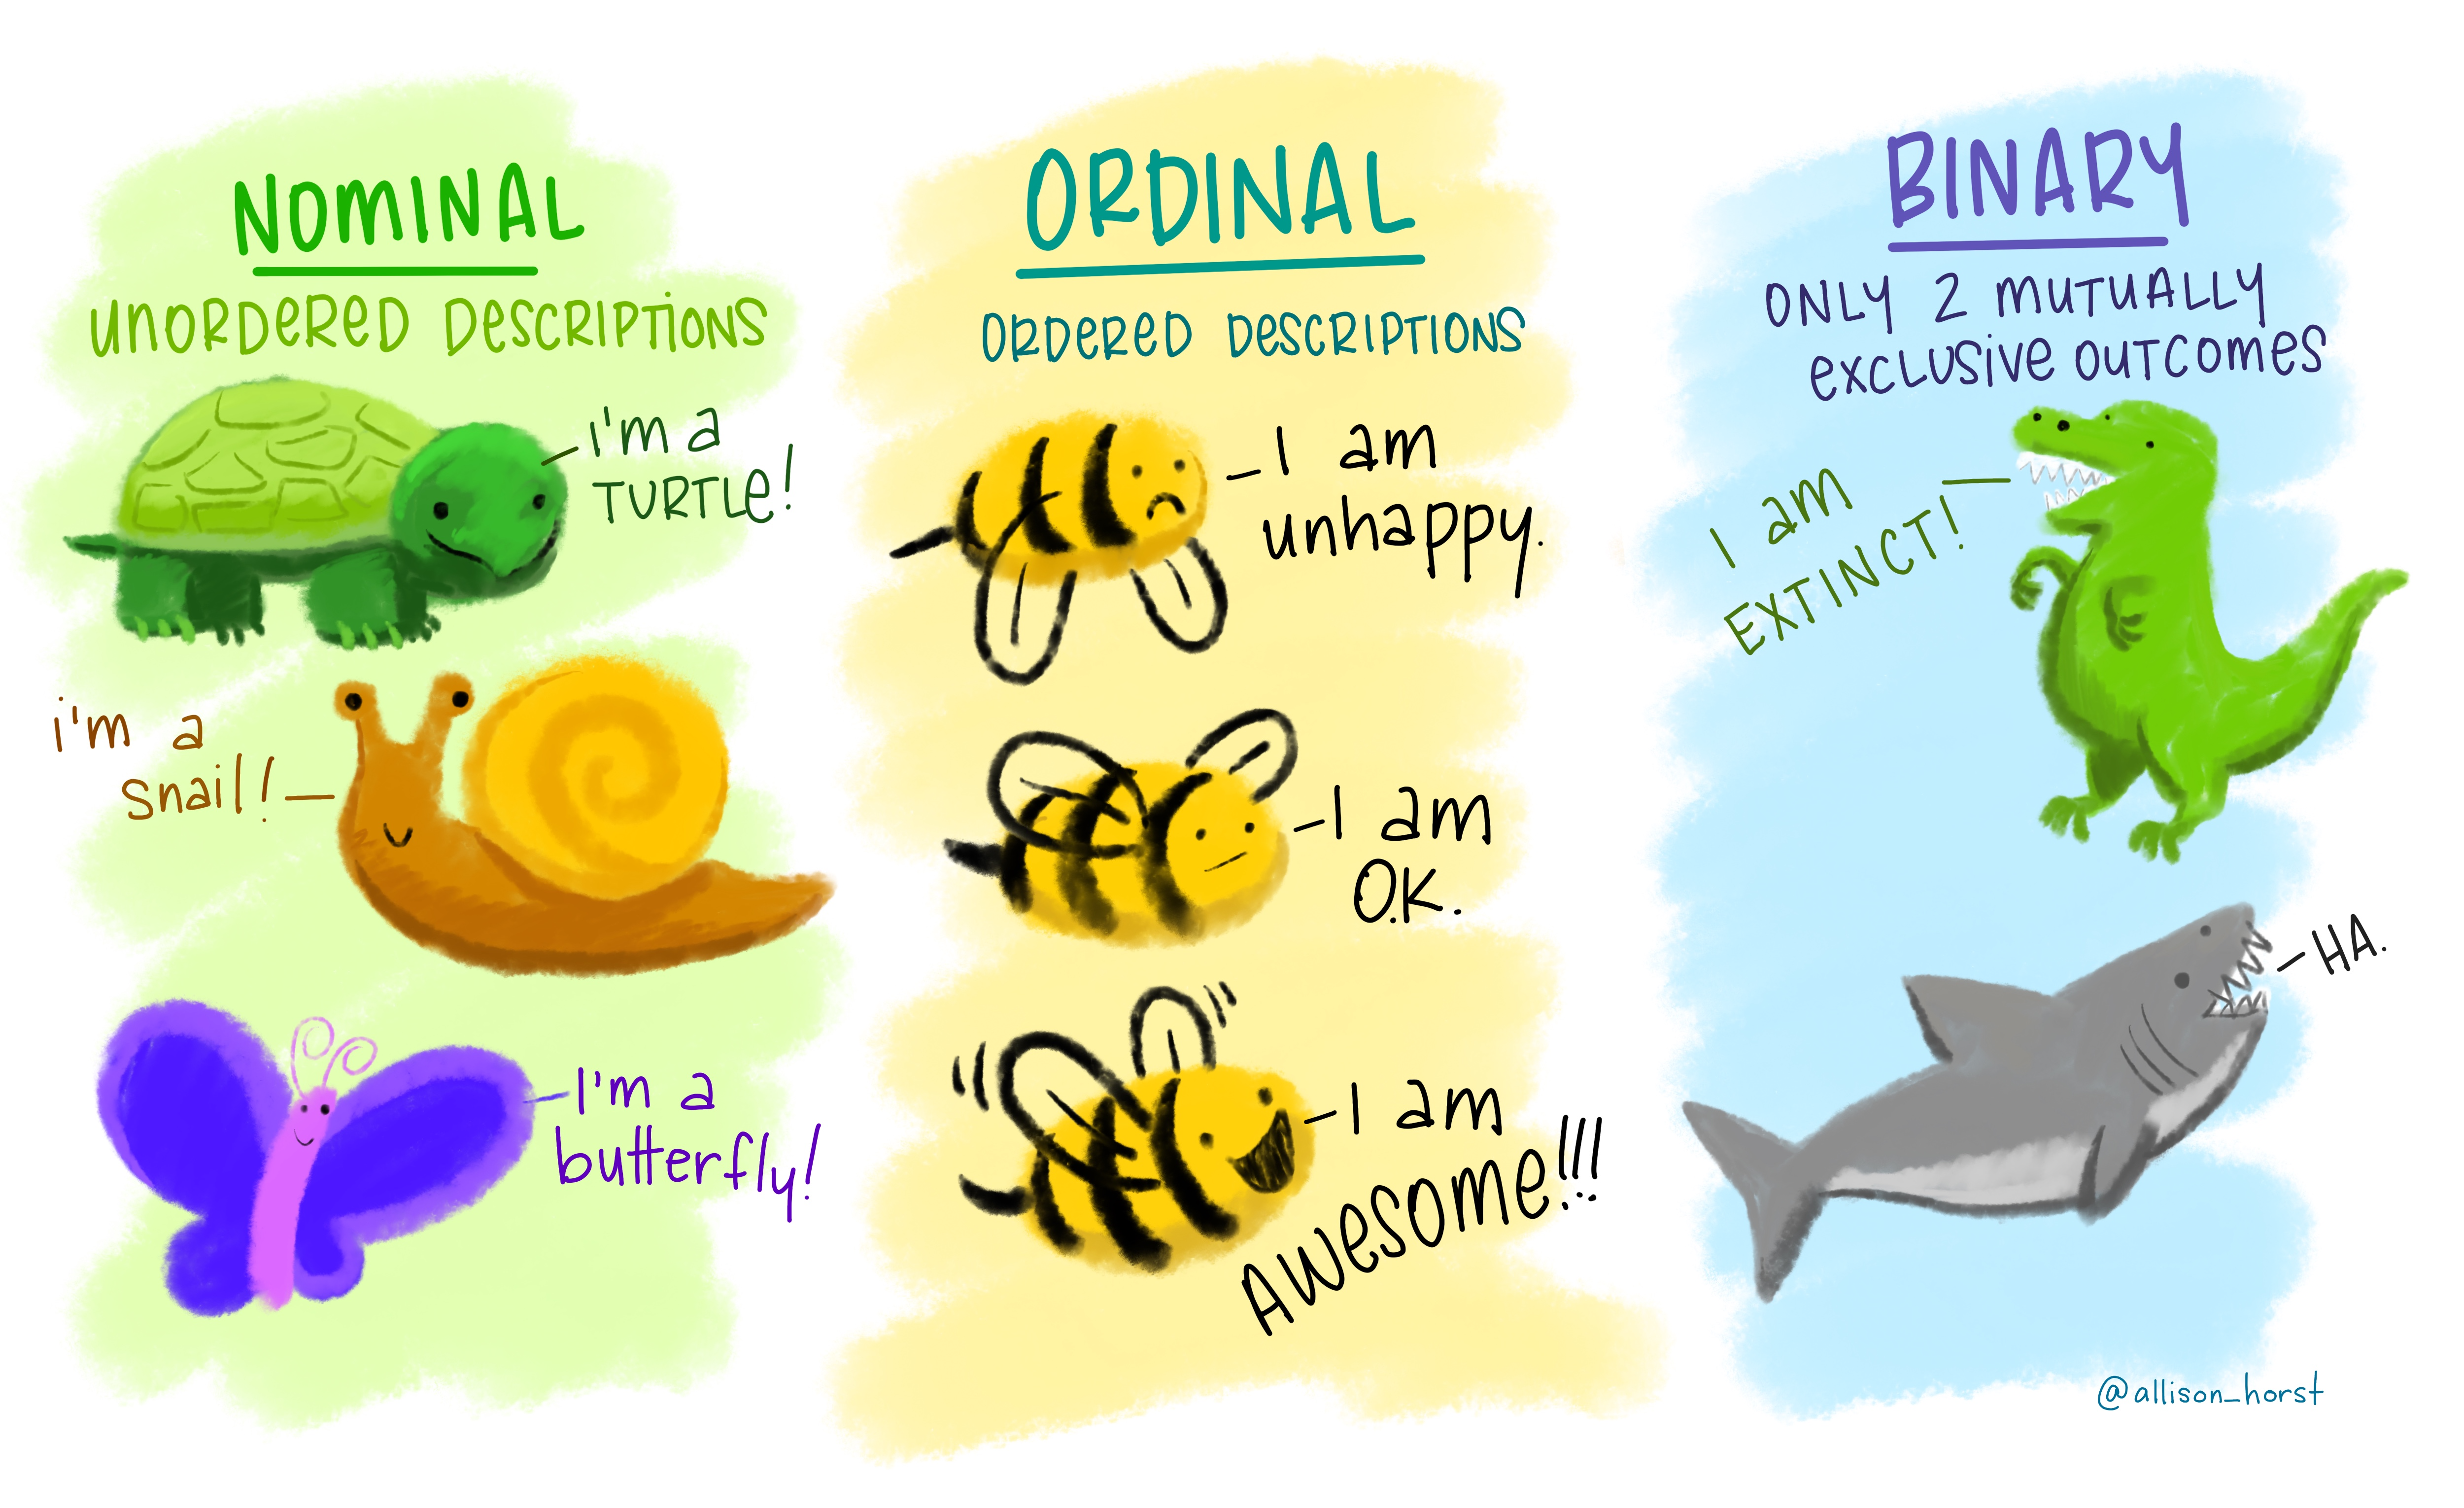
Art by Allison Horst
Visual Guide to Numerical Variable Types
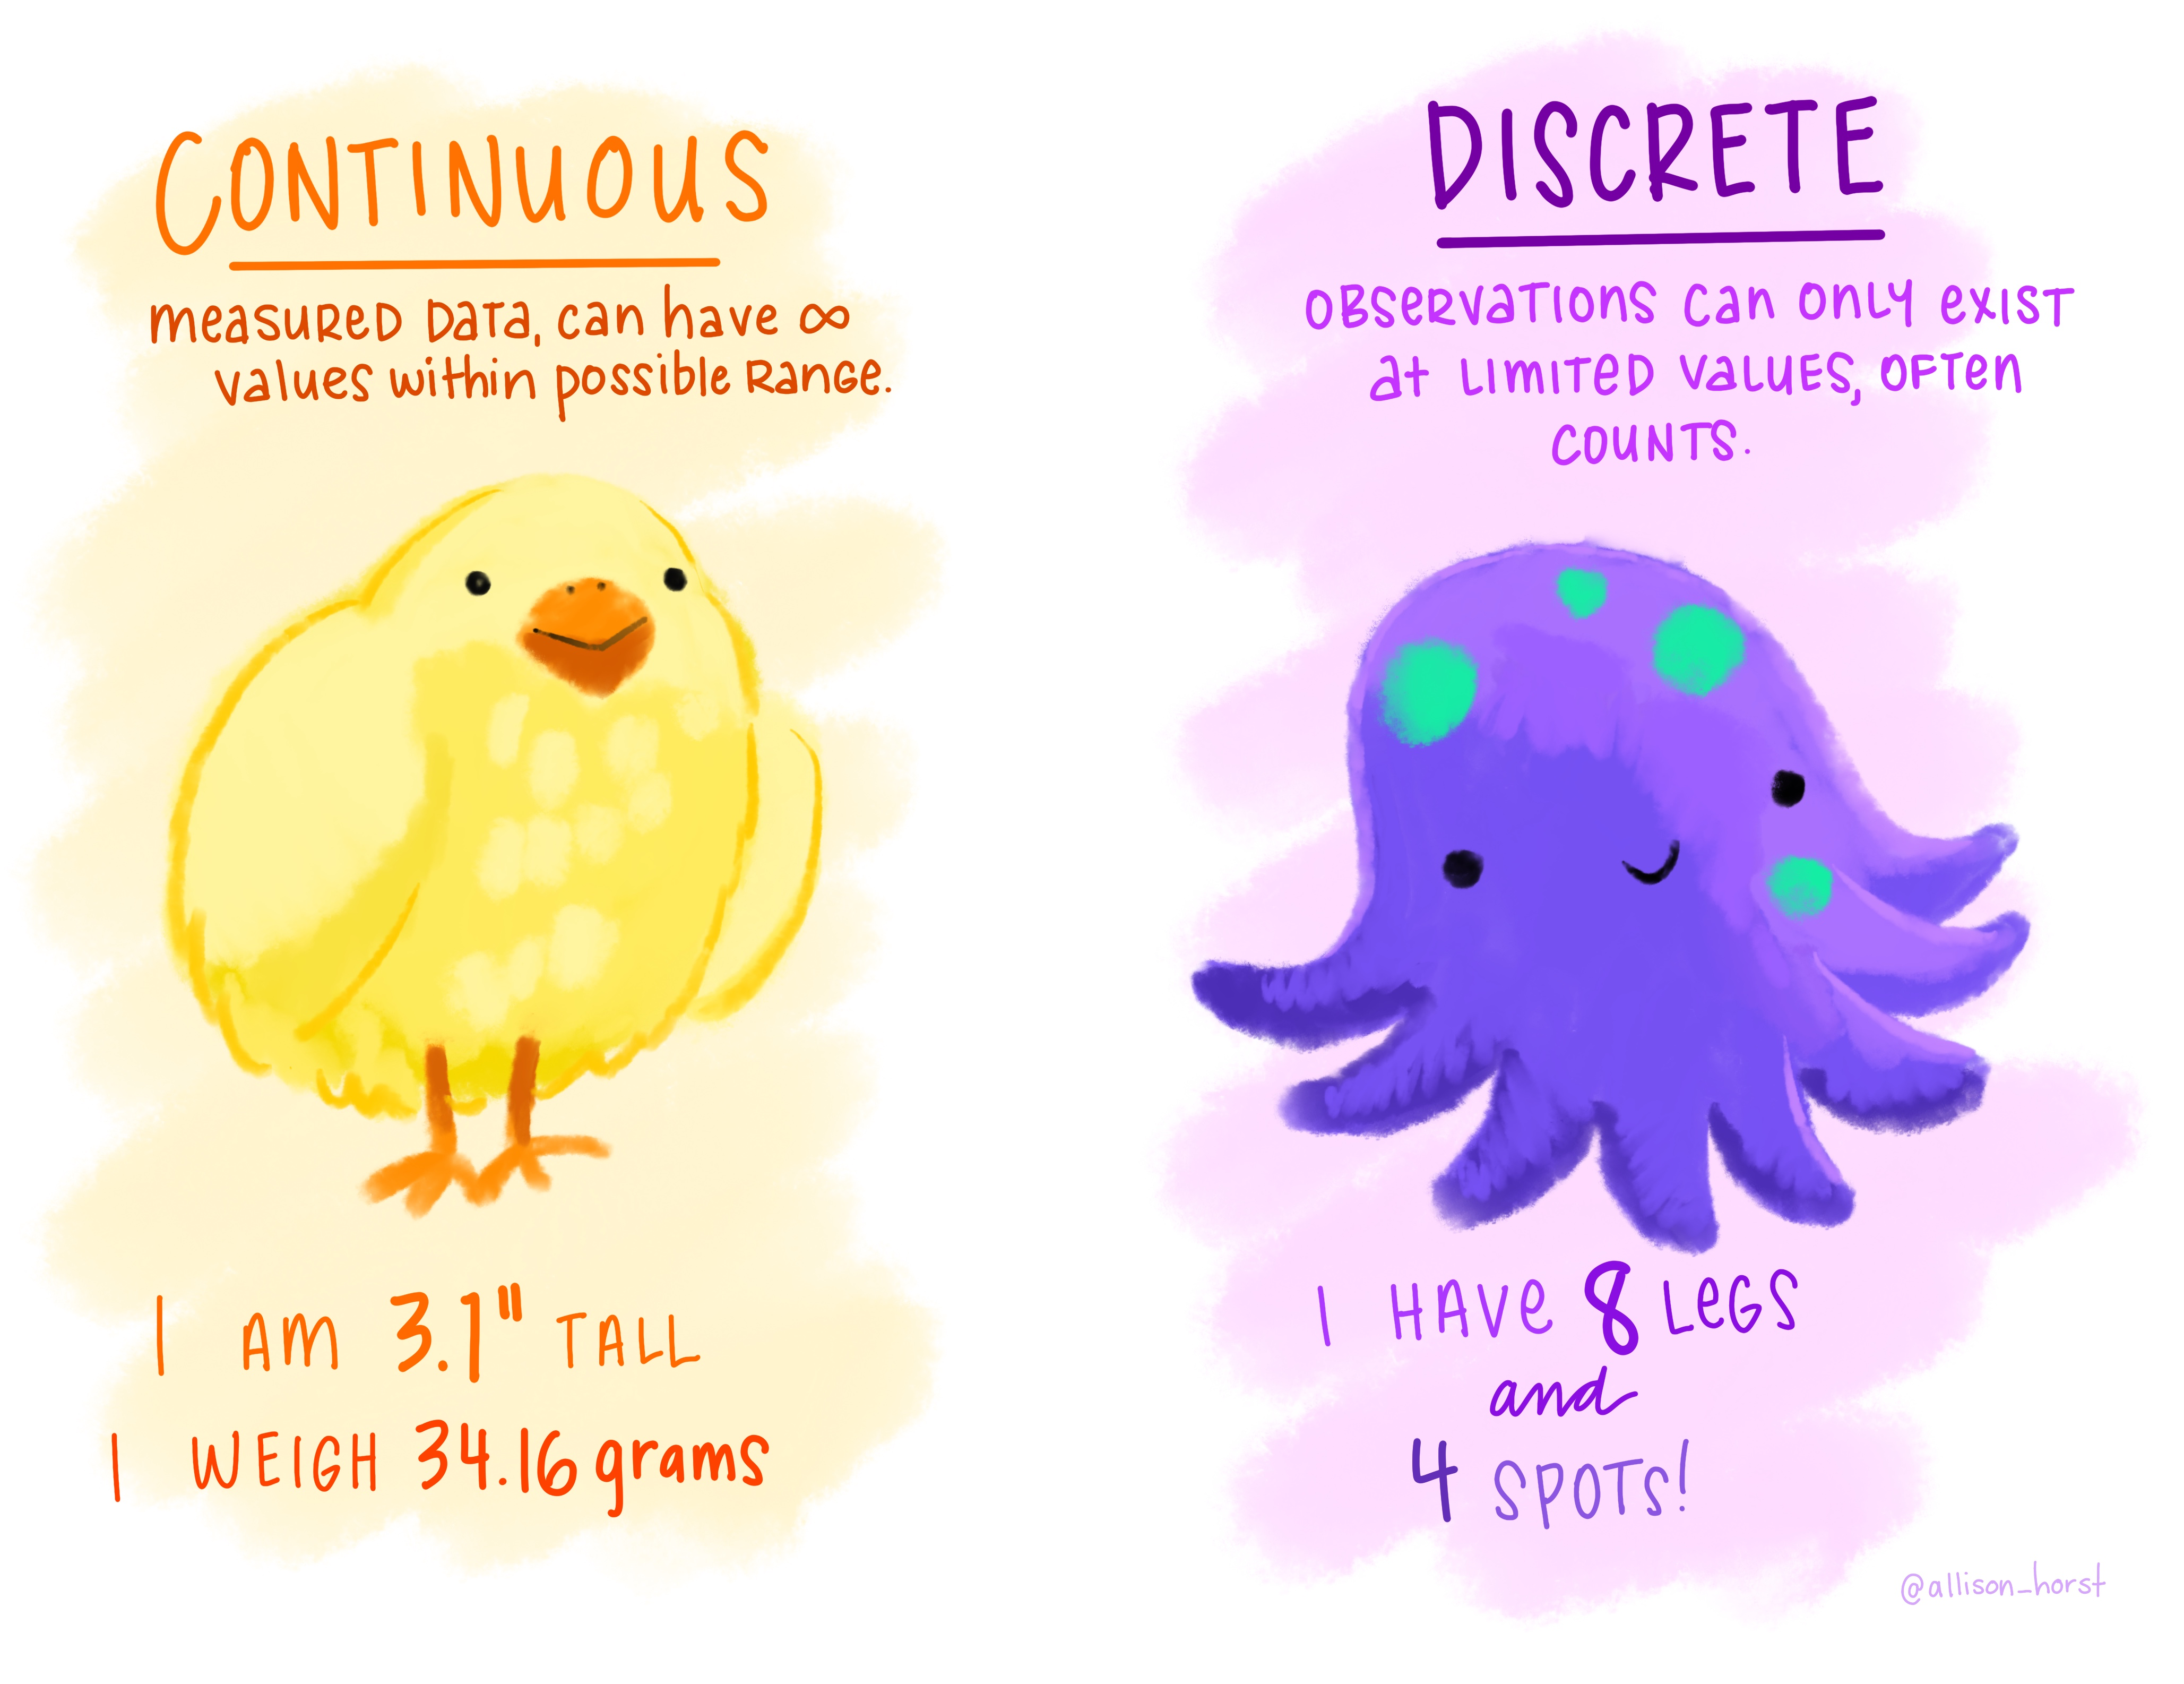
Art by Allison Horst
Example: Survivor Bias
WWII Bomber Study
During WWII, military officials wanted to determine where to add extra armor to bombers.
They recorded damage on planes that returned from missions.
Initial thought: Add armor where we see the most damage (wings, fuselage)
Problem: What about the planes that didn’t return?
Correct answer: Add armor where returning planes show little damage (engines, cockpit) — because planes hit there didn’t make it back!

Survivor bias: Only observing “survivors” gives a misleading picture of the full population
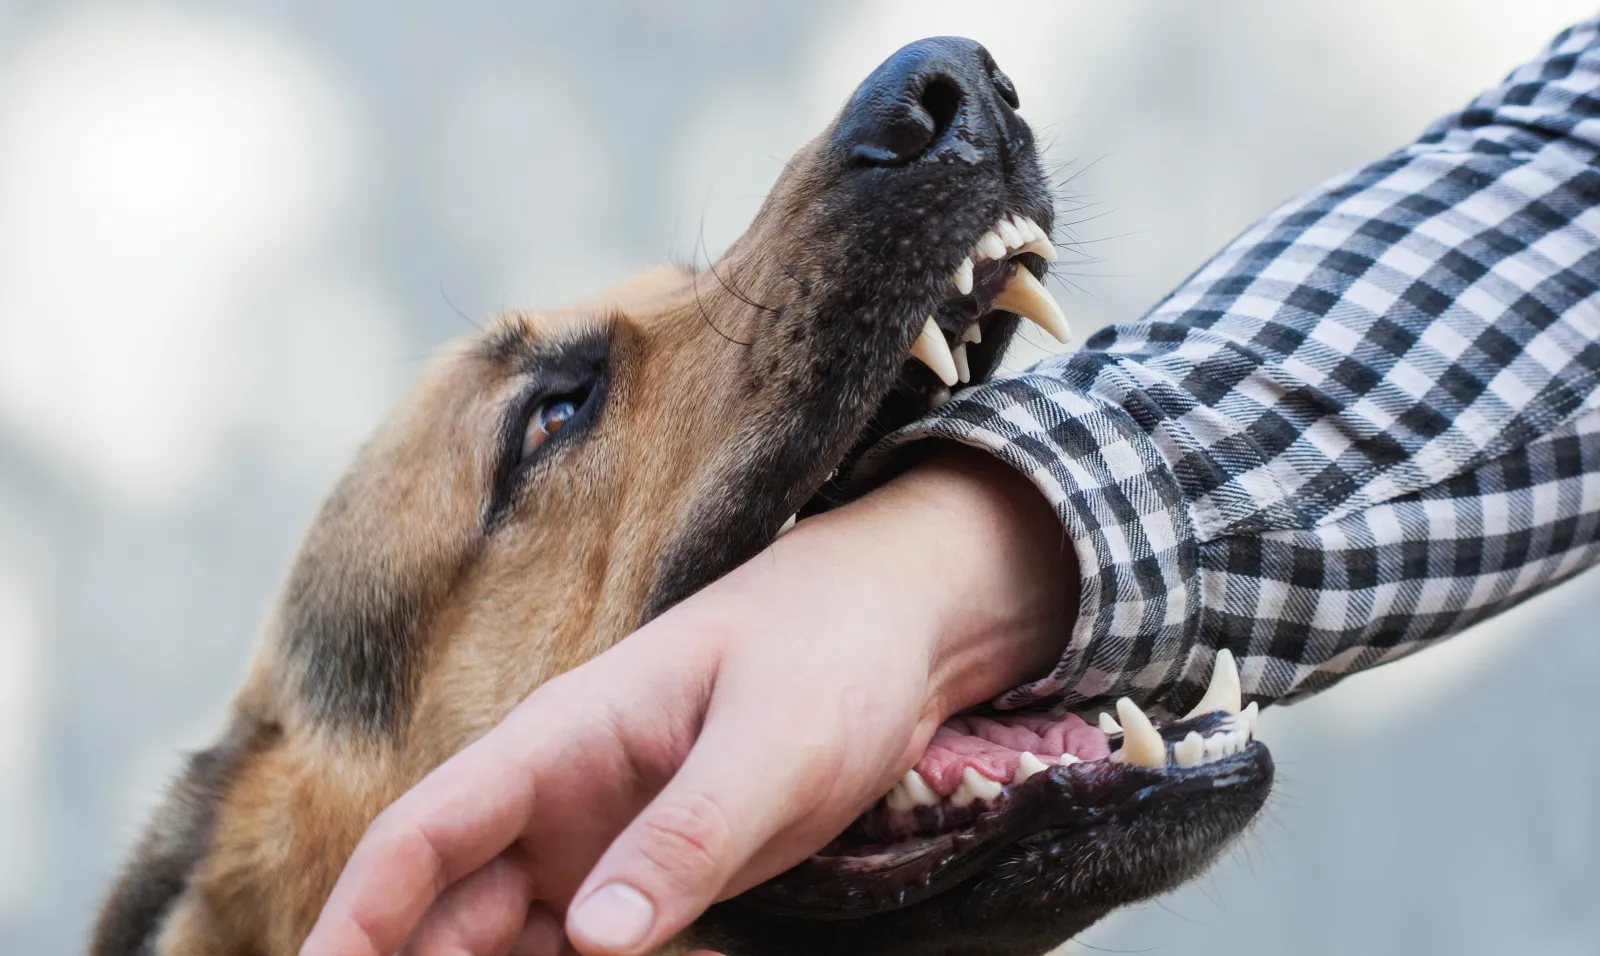
Example: Voluntary Response Bias
TikTok Poll
An influencer posted: “Have you ever been bitten by an animal?”
- TikTok users choose whether to respond
- 2,361 responses received
- 65% said “yes”, 35% said “no”
Questions:
- Are there issues with this data collection?
- Is 65% a good estimate for all people?
Problems:
- People bitten are more likely to respond
- TikTok users ≠ general population
- No random sampling
- Voluntary participation
Likely truth: Far less than 65% of all people have been bitten!