🗓️ Week 05
Regression in Practice & ANOVA
STAT 204 – Introduction to Statistical Data Analysis
22 Oct 2026
📜 Learning Pledge (reminder)
Programming is a systematic way to think about a problem — turning a fuzzy question into precise definitions and a chain of answers. Learning R is how we build that mental model.
There’s no point using AI if you’re trying to build that mental model yourself.
Part 1: Regression for Three Goals
Class Overview - Part 1
Today’s Focus:
- What is the model for? Describe, infer, predict
- Finishing Week 4: confidence intervals, the F-test, categorical predictors, interactions
- Checking regression assumptions with residuals
- Prediction: prediction intervals, overfitting, cross-validation
Learning Goals: Match what you report, and which assumptions you check, to the goal of the analysis
Three Goals for the Same Model
| 📊 Describe | 🔬 Infer | 🎯 Predict | |
|---|---|---|---|
| Question | What patterns are in this data? | What can we say about the population? | How well will it do on new data? |
| Main output | Coefficients, group means, fitted lines, \(R^2\) | Confidence intervals, \(t\) and \(F\) tests | predict(), prediction intervals, CV error |
| Assumptions that matter most | Linearity | Linearity, independence, constant variance, normality (small \(n\)) | Linearity, independence; constant variance and normality for prediction intervals |
| Choosing the model | The question picks the variables | Chosen before looking at results | Let the data choose (AIC, CV) |
Slides today are tagged 📊, 🔬 or 🎯 by goal.
Same lm(), Different Sentences
- 📊 Describe: “In these 342 penguins, those with 1 mm longer flippers weigh on average about 50 g more, holding bill size fixed.”
- 🔬 Infer: “We are 95% confident the population slope is between 45 and 55 g/mm.”
- 🎯 Predict: “A new penguin with 200 mm flippers, a 45 mm bill length and a 15 mm bill depth will weigh between about 3340 and 4895 g (95% prediction interval).”
Same model, different claims, different checks.
🔬 Confidence Intervals for Coefficients
- An interval for the population slope, not for this sample
- Valid only if the assumptions hold (diagnostics, below) and the model was chosen before looking at the results
🔬 F-test for Overall Model Significance
Tests: \(H_0\): All slope coefficients are zero (\(\beta_1 = \beta_2 = \cdots = \beta_p = 0\))
Test statistic: \[F = \frac{(\text{SST} - \text{SSR})/p}{\text{SSR}/(n-p-1)} = \frac{\text{MSR}}{\text{MSE}} \sim F_{p, n-p-1}\]
This appears at the bottom of summary() output.
🎯 Exercise: Reading the Model Summary
model1 <- lm(body_mass_g ~ flipper_length_mm, data = penguins)
model2 <- lm(body_mass_g ~ flipper_length_mm + bill_length_mm + bill_depth_mm,
             data = penguins)
summary(model2)
confint(model2)
# Questions:
# 1. What percentage of the variance in body mass does model2 explain?
# Compare summary(model1)$r.squared, summary(model2)$r.squared
# and summary(model2)$adj.r.squared. Did adding predictors help?
# 2. Which coefficients are statistically significant? Do any
# confidence intervals contain zero?
# 3. What are the F-statistic and its p-value? What do they tell you?
# 4. Can individual predictors be non-significant while the overall
# model is significant?📊 Fitted Values
library(ggplot2)

# Add predictions to data
penguins_fit <- penguins %>%
  drop_na(any_of(c("body_mass_g","bill_length_mm",
  "bill_depth_mm")))%>%
  mutate(fitted = fitted(model2),
         residuals = residuals(model2))

# Plot actual vs fitted
ggplot(penguins_fit, aes(x = fitted, y = body_mass_g)) +
  geom_point(alpha = 0.5) +
  geom_abline(slope = 1, intercept = 0, color = "blue") +
  labs(title = "Actual vs Fitted Values", x = "Fitted Body Mass (g)",y = "Actual Body Mass (g)")
📊 Categorical Predictors
R automatically creates dummy variables for factors:
The reference category (Adelie) is absorbed into the intercept.
📊 Interaction Terms
Does the effect of one predictor depend on another?
# Include an interaction between flipper length and species
model4 <- lm(body_mass_g ~ flipper_length_mm + species +
               flipper_length_mm:species,
             data = penguins)

# Shorthand
model4 <- lm(body_mass_g ~ flipper_length_mm * species,
             data = penguins)

summary(model4)

# See it: one fitted line per species. Different slopes = interaction
ggplot(penguins, aes(x = flipper_length_mm, y = body_mass_g, color = species)) +
  geom_point(alpha = 0.5) +
  geom_smooth(method = "lm", se = FALSE)
Which Assumptions Matter for Which Goal?
| Assumption | 📊 Describe | 🔬 Infer | 🎯 Predict |
|---|---|---|---|
| Linearity | Critical: a straight line must be an honest summary | Critical | Critical |
| Independence | Minor | Critical: standard errors are wrong without it | Matters: CV assumes it |
| Constant variance | Minor | Critical: affects SEs, tests, CIs | Matters for prediction intervals |
| Normality of errors | Not needed | Matters with small \(n\) | Matters for prediction intervals |
If assumptions are violated: descriptions can mislead, tests and CIs can be invalid, prediction intervals can be too narrow.
We check them with residuals.
Residuals: The Key to Diagnostics
Residual for observation \(i\): \(e_i = Y_i - \hat{Y}_i\)
Standardized residual: \(r_i = \dfrac{e_i}{\hat{\sigma}\sqrt{1 - h_{ii}}}\), where \(h_{ii}\) is the leverage of observation \(i\) (how unusual its \(X\) values are)
Diagnostic Plot 1: Residuals vs Fitted
Purpose: Check linearity and constant variance
- Random scatter around zero: Assumptions satisfied ✓
- Pattern or curve: Linearity violated ✗
- Funnel shape: Non-constant variance ✗
- Outliers: Points far from zero
Diagnostic Plot 2: Q-Q Plot
Purpose: Check normality of residuals
Points should fall approximately on the diagonal line.
- S-shape: Heavy tails (more extreme values than normal)
- Points above line on right / below on left: Right / left skew
- Minor deviations: Usually okay, especially with large \(n\)
🎯 Exercise: All Diagnostic Plots
📝 Self-Guided: Scale-Location, Leverage & Formal Tests
The scale-location and residuals vs leverage plots, the hat matrix, and the Breusch-Pagan, Shapiro-Wilk and Durbin-Watson tests are not covered live. See the Self-Guided Practice section at the end of these slides.
What If Assumptions Are Violated?
| What you see | What to try |
|---|---|
| Curve in residuals vs fitted | Transform \(X\), add a polynomial term or an interaction |
| Funnel shape | Transform \(Y\) (log, square root); for inference, robust standard errors |
| Outliers or heavy tails | Check the data first; then robust regression. Hurts inference and prediction intervals most |
| Dependence (time, clusters) | A different model: time series, mixed models |
Or try a different model family (GLM, GAM). Logistic regression is next week.
🎯 Prediction: Point Predictions and Intervals
- Confidence interval: for the mean mass of all penguins with these measurements (🔬)
- Prediction interval: for one new penguin. Always wider, and it relies on constant variance and normality (🎯)
How Complex Should the Model Be?
We often have many potential predictors. Questions:
- Which predictors should we include?
- Is a more complex model better?
- How do we balance fit vs. complexity?
📊🔬 For description and inference, the question chooses the model.
🎯 For prediction, we want the model that predicts best on new data.
Bias-Variance Tradeoff
Underfitting (too simple):
- High bias, low variance
- Poor fit to training and test data
Overfitting (too complex):
- Low bias, high variance
- Great fit to training data, poor on test data
Goal: Find the sweet spot!
🎯 Activity 1: Visualizing Overfitting
Work in pairs:
# Generate data with a simple relationship
set.seed(123)
x <- seq(0, 10, length.out = 20)
y <- 2 + 3*x + rnorm(20, sd = 5)

# Fit models of increasing complexity
fit_linear <- lm(y ~ x)
fit_cubic <- lm(y ~ poly(x, 3))
fit_10 <- lm(y ~ poly(x, 10))

# Plot and compare
par(mfrow=c(1,3))
plot(x, y, main="Linear (Simple)")
abline(fit_linear, col="red", lwd=2)

plot(x, y, main="Cubic (Moderate)")
lines(sort(x), fitted(fit_cubic)[order(x)], col="blue", lwd=2)

plot(x, y, main="10th degree (Complex)")
lines(sort(x), fitted(fit_10)[order(x)], col="green", lwd=2)
Discuss: Which model has the highest \(R^2\)? Which would you trust for a new \(x\)?
🎯 Cross-Validation: Estimating Prediction Error
Idea: Estimate prediction error on data the model has not seen.
K-Fold Cross-Validation:
- Split data into \(K\) folds
- For each fold: train on \(K-1\) folds, test on remaining fold
- Average the prediction errors (usually RMSE)
Common: \(K = 5\) or \(K = 10\). Leave-one-out CV is \(K = n\) (self-study).
Cross-Validation in R
# We'll use the caret package for easy CV implementation
# install.packages("caret") # if needed
library(caret)
library(palmerpenguins)

# Set up 10-fold cross-validation
train_control <- trainControl(method = "cv", number = 10)

# Fit model with 10-fold CV
model_cv10 <- train(body_mass_g ~ flipper_length_mm + bill_length_mm + species,
                    data = penguins,
                    method = "lm",
                    trControl = train_control,
                    na.action = na.omit)

# View results
print(model_cv10)
Linear Regression
344 samples
3 predictor
No pre-processing
Resampling: Cross-Validated (10 fold)
Summary of sample sizes: 308, 308, 307, 307, 309, 307, ...
Resampling results:
RMSE Rsquared MAE
339.7271 0.8272359 273.622
Tuning parameter 'intercept' was held constant at a value of TRUE🎯 Activity 2: Which Model Predicts Best?
library(caret)
library(palmerpenguins)

# Remove missing values first, so all models use the same rows
penguins_clean <- na.omit(penguins[, c("body_mass_g", "flipper_length_mm",
                                        "bill_length_mm", "bill_depth_mm",
                                        "species", "sex")])

ctrl <- trainControl(method = "cv", number = 10)

# Same seed = same folds for every model
cv_results <- function(formula) {
  set.seed(204)
  train(formula, data = penguins_clean, method = "lm", trControl = ctrl)$results
}

rbind(
  simple   = cv_results(body_mass_g ~ flipper_length_mm),
  moderate = cv_results(body_mass_g ~ flipper_length_mm + bill_length_mm + species),
  complex  = cv_results(body_mass_g ~ flipper_length_mm + bill_length_mm +
                          bill_depth_mm + species + sex)
)
Discuss:
- Which model has the lowest RMSE? Is the gain from moderate to complex worth it?
- Change the seed. Does the ranking change?
- Why is CV RMSE a more honest measure than \(R^2\) on the data used to fit?
📝 Self-Guided: More Cross-Validation
Leave-one-out CV and its shortcut for linear regression, comparing \(K = 5\), \(K = 10\) and LOOCV, a single train/test split, and K-fold CV by hand with a for loop are not covered live. See the Self-Guided Practice section at the end of these slides.
Part 1 Summary
Key Takeaways:
- Decide first: describe, infer or predict. It changes what you report and what you check
- 🔬 CIs and the F-test need the assumptions, and a model chosen in advance
- 📊 Categorical predictors and interactions describe how groups differ
- Residual plots check linearity, constant variance and normality
- 🎯 Prediction intervals are wider than confidence intervals
- 🎯 Cross-validation estimates error on new data; training \(R^2\) does not
Next class (Thu Oct 29): ANOVA for comparing groups, then variable selection
Part 2: ANOVA & Variable Selection
Class Overview - Part 2
Today’s Focus:
- One-way ANOVA as a linear model: the F-test, assumptions and effect size
- Multiple comparisons: which groups differ?
- Two-way ANOVA: two factors and their interaction
- Variable selection: AIC, BIC and stepwise, and when (not) to use them
Learning Goals: Compare means across several groups, and choose a model in a way that fits the goal
Analysis of Variance (ANOVA)
ANOVA Is a Linear Model with a Factor
Analysis of Variance compares means across multiple groups (3 or more). It is lm() with one categorical predictor:
- 📊 Describe: group means, and how much variation the groups explain (\(\eta^2\))
- 🔬 Infer: do the population means differ (F-test)? Which ones (Tukey)?
- 🎯 Predict: the prediction is the group mean (rarely the goal)
Example: Flicker Data
Critical flicker frequency for 19 subjects with different eye colors. Question: Do mean flicker frequencies differ by eye color?
flicker <- read.table(
  file="http://www.statsci.org/data/general/flicker.txt",
  header=TRUE, stringsAsFactors=TRUE)
levels(flicker$Colour)

# Summary statistics by group
meansd <- function(x) c(mean=mean(x), sd=sd(x))
by(flicker$Flicker, flicker$Colour, FUN=meansd)

boxplot(Flicker ~ Colour, data=flicker,
        ylab="Flicker", col=c('Blue','Brown','Green'))
ANOVA Model and Hypotheses
\[Y_{ij} = \mu_j + \varepsilon_{ij} \quad \text{or} \quad Y_{ij} = \mu + \alpha_j + \varepsilon_{ij}, \qquad \varepsilon_{ij} \sim N(0, \sigma^2) \text{ independent}\]
- \(Y_{ij}\) is the response for observation \(i\) in group \(j\)
- \(\mu_j\) is the mean for group \(j\); \(\mu\) is the overall mean and \(\alpha_j\) the effect of group \(j\)
Hypotheses:
\[H_0: \mu_1 = \mu_2 = \cdots = \mu_J \quad (\text{equivalently } \alpha_1 = \cdots = \alpha_J = 0)\] \[H_1: \text{Not all } \mu_j \text{ are equal}\]
Partitioning Variance
Total variation can be decomposed:
\[\underbrace{\sum_{j=1}^J\sum_{i=1}^{n_j} (Y_{ij} - \bar{y})^2}_{SS_{total}} = \underbrace{\sum_{j=1}^J n_j(\bar{y}_j - \bar{y})^2}_{SS_{reg} \text{ (between)}} + \underbrace{\sum_{j=1}^J\sum_{i=1}^{n_j} (Y_{ij} - \bar{y}_j)^2}_{SS_{res} \text{ (within)}}\]
- Between groups: Variation explained by group differences
- Within groups: Unexplained variation (error)
Mean squares: \(MS_{reg} = \dfrac{SS_{reg}}{J-1}\), \(\quad MS_{res} = \dfrac{SS_{res}}{N-J}\)
📊 \(\eta^2 = SS_{reg}/SS_{total}\) is the share of variation explained by the groups (like \(R^2\)).
F-Statistic and the ANOVA Table
Under \(H_0\): \(F = \dfrac{MS_{reg}}{MS_{res}} \sim F_{J-1, N-J}\). Under \(H_1\), \(E[MS_{reg}] > \sigma^2\), so \(F\) tends to be larger than 1.
Decision rule: Reject \(H_0\) if \(F > F_{J-1, N-J, \alpha}\)
| Source | df | SS | MS | F |
|---|---|---|---|---|
| Between Groups | \(J-1\) | \(SS_{reg}\) | \(MS_{reg}\) | \(\frac{MS_{reg}}{MS_{res}}\) |
| Within Groups | \(N-J\) | \(SS_{res}\) | \(MS_{res}\) | |
| Total | \(N-1\) | \(SS_{total}\) |
Running ANOVA in R
Checking ANOVA Assumptions
The same residual plots as in Part 1:
- Independence: addressed by study design (random sampling/assignment)
- Normality of residuals: Q-Q plot. Robust to mild violations with balanced designs
- Equal variances across groups: residuals vs fitted, Levene’s test. Rule of thumb: largest SD < 2 × smallest SD
What to Do When Assumptions Are Violated
- Normality violated: transform \(Y\) (log, square root), or use the Kruskal-Wallis test (compares distributions, not just means)
- Unequal variances: use Welch’s ANOVA, which does not assume equal variances
- Independence violated: a serious problem that transformations cannot fix. Use repeated measures ANOVA or mixed models
🎯 Activity 1: Conduct Your Own ANOVA
# Does flipper length differ by species?
model_flipper <- aov(flipper_length_mm ~ species,
                     data=penguins)
summary(model_flipper)

# Check assumptions
par(mfrow=c(2,2))
plot(model_flipper)

library(car)
leveneTest(flipper_length_mm ~ species, data=penguins)
by(penguins$flipper_length_mm, penguins$species,
   sd, na.rm=TRUE)

# Effect size (eta-squared)
ss <- summary(model_flipper)[[1]]$"Sum Sq"
ss[1] / sum(ss)
Questions:
- What are the F-statistic and p-value? Do you reject \(H_0\)?
- Are the assumptions satisfied? Is the max SD / min SD < 2?
- How large is the effect (\(\eta^2\))?
- What does this mean scientifically?
Multiple Comparisons Problem
After rejecting \(H_0\): Which group means are different?
Naive approach: Conduct separate t-tests for each pair
Problem: Family-wise error rate inflation!
For \(m\) tests at level \(\alpha = 0.05\):
- 3 tests: \(P(\text{Type I error}) = 1-(0.95)^3 = 0.143\)
- 10 tests: \(P(\text{Type I error}) = 1-(0.95)^{10} \approx 0.40\)
Solution: Use multiple comparison procedures!
Tukey’s HSD and Other Adjustments
- Tukey’s HSD: controls the family-wise error rate; best for all pairwise comparisons
- Bonferroni: very conservative; use with a few planned comparisons
- Holm: less conservative than Bonferroni, still controls the family-wise error rate
- Fisher’s LSD / no adjustment: does not control the family-wise error rate
🎯 Activity 2: Multiple Comparisons
# Continue with the penguin flipper length analysis

# 1. Perform Tukey's HSD
tukey_results <- TukeyHSD(model_flipper)
tukey_results
plot(tukey_results)

# 2. Try different adjustment methods
pairwise.t.test(penguins$flipper_length_mm, penguins$species,
                p.adjust = "none")

pairwise.t.test(penguins$flipper_length_mm, penguins$species,
                p.adjust = "bonferroni")

pairwise.t.test(penguins$flipper_length_mm, penguins$species,
                p.adjust = "holm")
Questions:
- Which species pairs differ statistically significantly?
- How do the different adjustment methods compare?
- Which method would you report and why?
Two-Way ANOVA
Two Factors and Their Interaction
Two factors with possible interaction, like the interaction terms in regression.
Example: Survival times for animals exposed to:
- 3 types of poison (I, II, III)
- 4 types of treatment (A, B, C, D)
Model: \[y_{ijk} = \mu + \alpha_i + \beta_j + \gamma_{ij} + \epsilon_{ijk}\]
where:
- \(\alpha_i\): poison effect
- \(\beta_j\): treatment effect
- \(\gamma_{ij}\): interaction effect
Poison Data
   Time Poison Treatment
1  0.31      I         A
2  0.45      I         A
3  0.46      I         A
4  0.43      I         A
5  0.36     II         A
6  0.29     II         A
7  0.40     II         A
8  0.23     II         A
9  0.22    III         A
10 0.21    III         A
11 0.18    III         A
12 0.23    III         A
13 0.82      I         B
14 1.10      I         B
15 0.88      I         B
16 0.72      I         B
17 0.92     II         B
18 0.61     II         B
19 0.49     II         B
20 1.24     II         B
Interaction Plots
Visualize potential interactions:
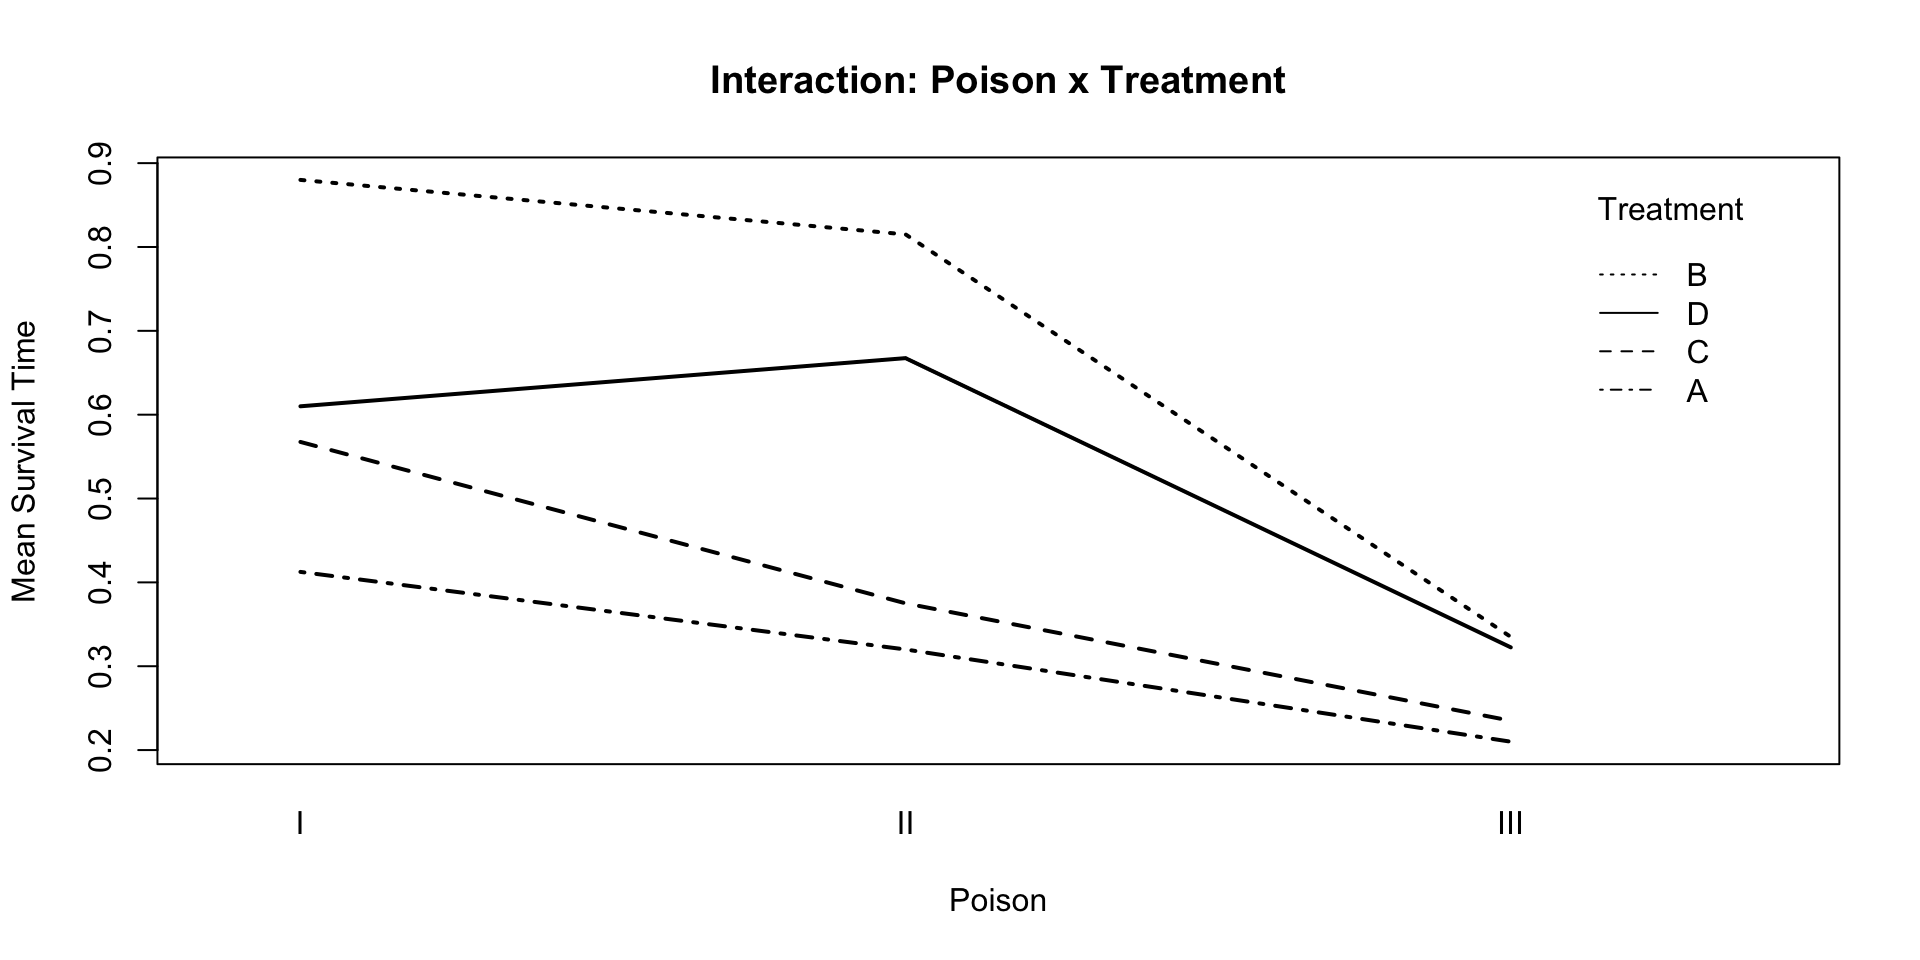
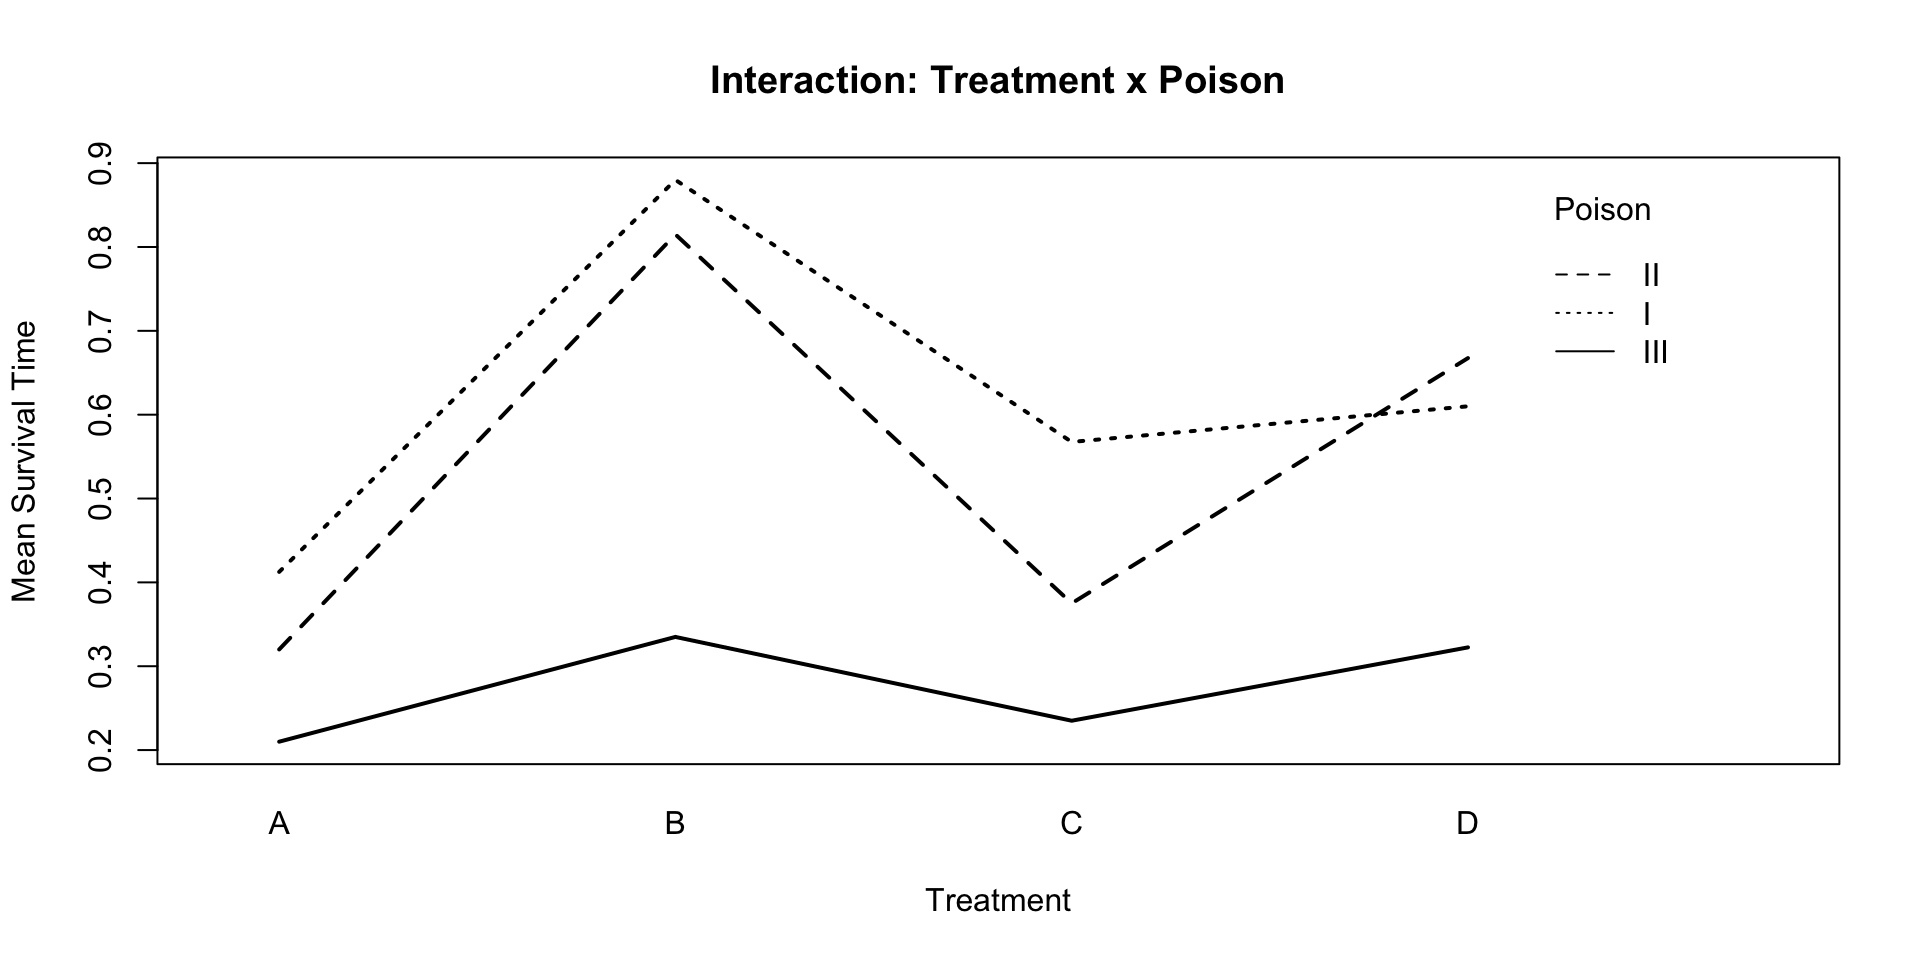
Non-parallel lines suggest interaction.
Two-Way ANOVA with Interaction
Analysis of Variance Table

Response: Time
                 Df  Sum Sq Mean Sq F value    Pr(>F)
Poison            2 1.03708 0.51854 23.3314 3.176e-07 ***
Treatment         3 0.92012 0.30671 13.8000 3.792e-06 ***
Poison:Treatment  6 0.25027 0.04171  1.8768    0.1118
Residuals        36 0.80010 0.02222
---
Signif. codes:  0 '***' 0.001 '**' 0.01 '*' 0.05 '.' 0.1 ' ' 1
Interpretation:
- Interaction is not statistically significant (p = 0.1118)
- Both main effects are statistically significant
Two-Way ANOVA without Interaction
Analysis of Variance Table

Response: Time
          Df  Sum Sq Mean Sq F value    Pr(>F)
Poison     2 1.03708 0.51854  20.734 5.448e-07 ***
Treatment  3 0.92012 0.30671  12.264 6.743e-06 ***
Residuals 42 1.05037 0.02501
---
Signif. codes: 0 '***' 0.001 '**' 0.01 '*' 0.05 '.' 0.1 ' ' 1Tables of means
Grand mean
0.4791667
Poison
Poison
I II III
0.6175 0.5444 0.2756
Treatment
Treatment
A B C D
0.3142 0.6767 0.3925 0.5333 Tukey HSD for Two Factors
  Tukey multiple comparisons of means
    95% family-wise confidence level

Fit: aov(formula = Time ~ Poison + Treatment, data = poison)

$Poison
            diff        lwr         upr     p adj
II-I   -0.073125 -0.2089618  0.06271181 0.3987984
III-I  -0.341875 -0.4777118 -0.20603819 0.0000008
III-II -0.268750 -0.4045868 -0.13291319 0.0000582

$Treatment
           diff         lwr        upr     p adj
B-A  0.36250000  0.18980177  0.5351982 0.0000083
C-A  0.07833333 -0.09436490  0.2510316 0.6219967
D-A  0.21916667  0.04646843  0.3918649 0.0079262
C-B -0.28416667 -0.45686490 -0.1114684 0.0004077
D-B -0.14333333 -0.31603157  0.0293649 0.1344032
D-C  0.14083333 -0.03186490  0.3135316 0.1451135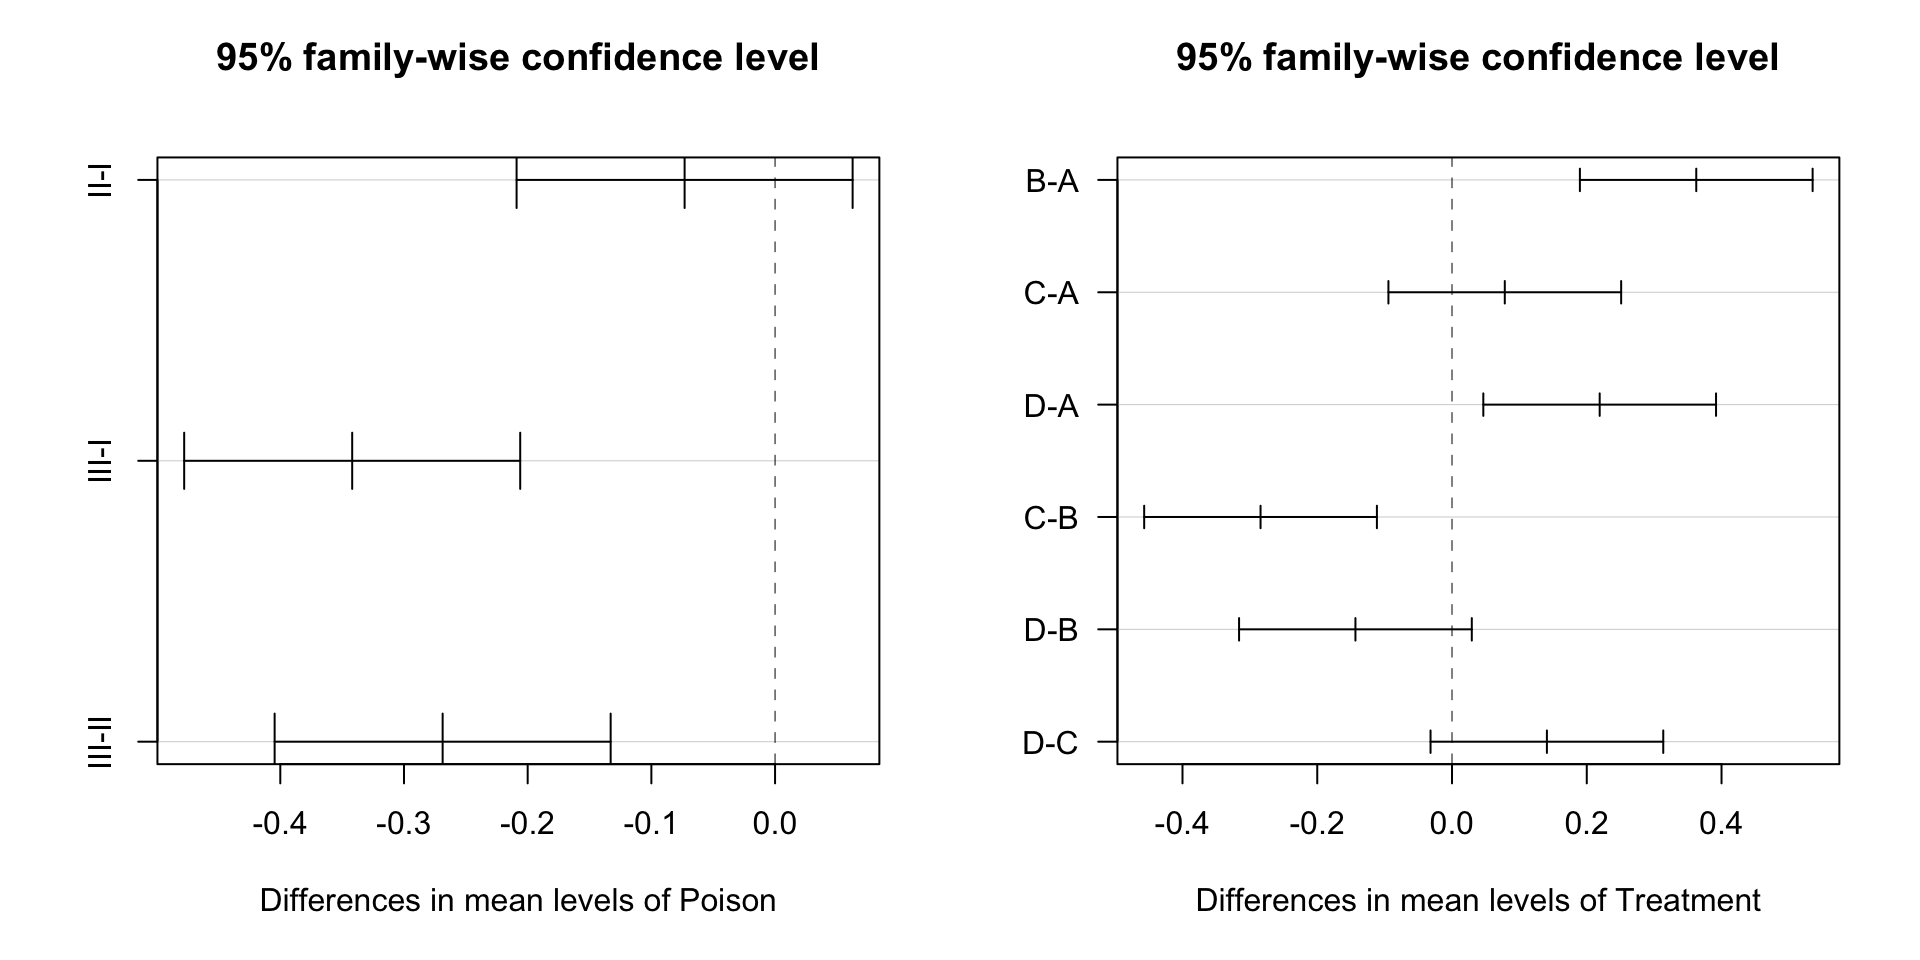
Variable Selection
Model Selection Depends on the Goal
- 📊 Describe: the question picks the variables. Prefer a model you can explain.
- 🔬 Infer: pick the model before looking at results, using theory or the study design. If you select the model and test it on the same data, p-values are too small and CIs too narrow.
- 🎯 Predict: let the data choose, with AIC, BIC or cross-validation. Hard-to-interpret terms and correlated predictors are fine if they predict well.
Regularization (Ridge, Lasso) is another way to choose for prediction: we cover it on Tue Nov 17.
Information Criteria: AIC and BIC
Both balance model fit and complexity, with \(p\) parameters and likelihood \(L\):
\[\text{AIC} = -2\log(L) + 2p \qquad \text{BIC} = -2\log(L) + p\log(n)\]
For linear regression: \[\text{AIC} = n\log(\text{SSR}/n) + 2p \qquad \text{BIC} = n\log(\text{SSR}/n) + p\log(n)\]
- Lower is better. Both penalize adding parameters
- BIC penalizes complexity more, so it tends to select simpler models
- Guideline: an AIC difference > 2 suggests the models are meaningfully different
🎯 Exercise: Compare with AIC/BIC
model1 <- lm(body_mass_g ~ flipper_length_mm, data = penguins)
model2 <- lm(body_mass_g ~ flipper_length_mm + bill_length_mm + bill_depth_mm,
             data = penguins)
model3 <- lm(body_mass_g ~ flipper_length_mm + species, data = penguins)

AIC(model1, model2, model3)
BIC(model1, model2, model3)

# Questions:
# 1. Which model has the lowest AIC? The lowest BIC?
# 2. Are they the same model?
# 3. How much do AIC values differ?
Stepwise Selection
- Forward: start with the intercept only; add the predictor that improves AIC most; stop when nothing helps
- Backward: start with all predictors; remove the one whose removal improves AIC most
- Both: at each step, add or remove
# Use complete cases, so every candidate model uses the same rows
penguins_complete <- na.omit(penguins)

full_model <- lm(body_mass_g ~ flipper_length_mm + bill_length_mm +
                   bill_depth_mm + species,
                 data = penguins_complete)

step(lm(body_mass_g ~ 1, data = penguins_complete),
     scope = formula(full_model), direction = "forward")
step(full_model, direction = "backward")
step(full_model, direction = "both")
🎯 Exercise: Stepwise Selection
# Create a full model with all available predictors
full_model <- lm(body_mass_g ~ flipper_length_mm + bill_length_mm +
                   bill_depth_mm + species + sex + island,
                 data = penguins_complete)

# Try different directions
step_forward <- step(lm(body_mass_g ~ 1, data = penguins_complete),
                     scope = formula(full_model),
                     direction = "forward")

step_backward <- step(full_model, direction = "backward")

# Do they give the same final model?
⚠️ Stepwise Is a Prediction Tool
After stepwise selection, summary() of the chosen model is too optimistic:
- p-values are too small and confidence intervals too narrow
- Coefficients of the selected predictors tend to be too large in magnitude
- The test does not know you tried many models first
So:
- 🎯 Use stepwise or AIC to build a predictive model, then check it with cross-validation
- 🔬 For inference, choose the model from theory or design, or select on one part of the data and test on another
Best Practices by Goal
| 📊 | 🔬 | 🎯 | |
|---|---|---|---|
| Start from domain knowledge and the question | ✓ | ✓ | ✓ |
| Check diagnostics for the final model | ✓ | ✓ | ✓ |
| Check multicollinearity (VIF), don’t include perfectly correlated predictors | ✓ | ✓ | |
| Fix the model before seeing results | ✓ | ||
| Don’t use automated selection blindly; understand why predictors are selected | ✓ | ✓ | ✓ |
| Validate on new data or with CV; never test on the data used for selection | ✓ | ||
| Don’t rely only on \(R^2\); use several criteria | ✓ | ✓ | ✓ |
| Prefer the simpler model when performance is similar | ✓ | ✓ | |
| Document how you chose the model | ✓ | ✓ | ✓ |
🎯 Final Exercise: Complete Analysis
Using the penguins data:
- State your goal: describe, infer or predict body mass?
- Fit several candidate models (try species and an interaction)
- Check assumptions with diagnostic plots
- Calculate VIF for multicollinearity (
car::vif()) - Choose a model in a way that matches your goal: theory, AIC/BIC or cross-validation
- Report what fits your goal: coefficients, CIs, or prediction intervals and CV RMSE
- Interpret in context
📝 Self-Guided: More ANOVA
Transformations and Box-Cox, Bartlett’s test, compact letter displays, and diagnostics for two-way ANOVA are not covered live. See the Self-Guided Practice section at the end of these slides.
Part 2 Summary
Key Takeaways:
- ANOVA is a linear model with a factor; the F-test asks whether any group means differ
- Check assumptions with the same residual plots, plus Levene’s test or the SD rule
- Welch’s ANOVA, Kruskal-Wallis or transformations when assumptions fail
- Rejecting \(H_0\) means “not all equal”: use Tukey or adjusted pairwise tests to find which differ
- Two-way ANOVA adds a second factor; check the interaction (non-parallel lines) before the main effects
- Choose the model to fit the goal. Stepwise and AIC are for prediction; their p-values are too optimistic
Final Questions & Next Steps
Next class (Tue Nov 3): Project proposal presentations
- 3 minutes per group, groups 1 to 13 in order. Have your slides ready to share
- Cover your question, why it matters, your data (or the original study), and your planned analysis
Then: logistic regression (Thu Nov 5). HW4 is released today
Office Hours: Tuesdays and Thursdays, 3:15 pm - 4:00 pm (before lecture)
📝 Self-Guided Practice (Wednesday Session)
The following slides are not covered live. Work through them on your own, or bring questions to the Wednesday self-guided session.
Diagnostic Plot 3: Scale-Location
Purpose: Check homoscedasticity
This plots \(\sqrt{|\text{standardized residuals}|}\) vs fitted values.
What to look for: Horizontal line with equal spread → constant variance ✓
Leverage and the Hat Matrix
The fitted values are \(\hat{\mathbf{Y}} = \mathbf{H}\mathbf{Y}\), with the hat matrix
\[\mathbf{H} = \mathbf{X}(\mathbf{X}^T\mathbf{X})^{-1}\mathbf{X}^T\]
The leverage \(h_{ii}\) is the \(i\)-th diagonal element of \(\mathbf{H}\). Observations with unusual \(X\) values have high leverage.
Diagnostic Plot 4: Residuals vs Leverage
Purpose: Identify influential observations
Cook’s distance measures influence of each observation.
Rule of thumb: Cook’s distance > 1 indicates influential point.
Statistical Tests: Breusch-Pagan Test
Tests for heteroscedasticity.
\(H_0\): Homoscedasticity (constant variance)
If p-value is very small: Reject \(H_0\), evidence of heteroscedasticity.
Statistical Tests: Shapiro-Wilk Test
Tests for normality of residuals.
\(H_0\): Residuals are normally distributed
Important: With large \(n\), this test is very sensitive. Visual inspection (Q-Q plot) often more useful.
Durbin-Watson Test for Independence
Tests for autocorrelation in residuals (common in time series).
\(H_0\): No autocorrelation
Test statistic ≈ 2 suggests no autocorrelation.
🎯 Exercise: Formal Tests
Leave-One-Out Cross-Validation (LOOCV)
Special case: \(K = n\)
CV error: \[\text{CV} = \frac{1}{n}\sum_{i=1}^{n}(Y_i - \hat{Y}_{-i})^2\]
where \(\hat{Y}_{-i}\) is prediction for \(i\) using model trained without observation \(i\).
Computationally expensive but can use shortcut for linear regression!
LOOCV Shortcut for Linear Regression
\[\text{CV} = \frac{1}{n}\sum_{i=1}^{n}\left(\frac{e_i}{1 - h_{ii}}\right)^2\]
where \(e_i\) is the residual and \(h_{ii}\) is the leverage.
This is also called the PRESS statistic (Predicted Residual Sum of Squares).
Comparing CV Methods
This uses penguins_clean from Activity 2 of Part 1.
model_formulas <- list(
  simple = body_mass_g ~ flipper_length_mm,
  moderate = body_mass_g ~ flipper_length_mm + bill_length_mm + species,
  complex = body_mass_g ~ flipper_length_mm + bill_length_mm +
                          bill_depth_mm + species + sex
)

# Function to perform CV with different K values
compare_cv_methods <- function(formula, data) {

  # 5-Fold CV
  ctrl_5fold <- trainControl(method = "cv", number = 5)
  cv5 <- train(formula, data = data, method = "lm", trControl = ctrl_5fold)

  # 10-Fold CV
  ctrl_10fold <- trainControl(method = "cv", number = 10)
  cv10 <- train(formula, data = data, method = "lm", trControl = ctrl_10fold)

  # Leave-One-Out CV (LOOCV)
  ctrl_loocv <- trainControl(method = "LOOCV")
  loocv <- train(formula, data = data, method = "lm", trControl = ctrl_loocv)

  # Return RMSE values
  return(data.frame(
    CV5_RMSE = cv5$results$RMSE,
    CV10_RMSE = cv10$results$RMSE,
    LOOCV_RMSE = loocv$results$RMSE
  ))
}

results_simple <- compare_cv_methods(model_formulas$simple, penguins_clean)
results_moderate <- compare_cv_methods(model_formulas$moderate, penguins_clean)
results_complex <- compare_cv_methods(model_formulas$complex, penguins_clean)

data.frame(
  Model = c("Simple", "Moderate", "Complex"),
  rbind(results_simple, results_moderate, results_complex)
)

# 1. Are the RMSE values similar across K = 5, K = 10 and LOOCV?
# 2. Which method took longest to run? Why?
# 3. LOOCV has lower bias but higher variance; K-fold the reverse.
#    When would you use each? How does dataset size affect the choice?
Single Train/Test Split
set.seed(456)
train_idx <- sample(1:nrow(penguins_clean), size = 0.8 * nrow(penguins_clean))

train_data <- penguins_clean[train_idx, ]
test_data <- penguins_clean[-train_idx, ]

# Fit on training data
model_train <- lm(body_mass_g ~ flipper_length_mm + bill_length_mm + species,
                  data = train_data)

# Predict on test data
test_predictions <- predict(model_train, newdata = test_data)
test_rmse <- sqrt(mean((test_data$body_mass_g - test_predictions)^2))

cat("Single Train/Test Split RMSE:", round(test_rmse, 2), "\n")
cat("10-Fold CV RMSE:", round(results_moderate$CV10_RMSE, 2), "\n")

# 1. Which estimate is more reliable? Why?
# 2. What happens if you change the random seed?
# 3. When might a single split be preferred (e.g., time series)?
Manual K-Fold CV
For deeper understanding, implement CV manually. This uses penguins_clean from Activity 2 of Part 1.
# Manual 5-fold cross-validation
set.seed(123)
n <- nrow(penguins_clean)
K <- 5

# Create fold assignments
fold_ids <- sample(rep(1:K, length.out = n))

# Store predictions
cv_errors <- numeric(K)

for(k in 1:K) {
  # Split data
  test_idx <- which(fold_ids == k)
  train_data <- penguins_clean[-test_idx, ]
  test_data <- penguins_clean[test_idx, ]

  # Fit model on training data
  model <- lm(body_mass_g ~ flipper_length_mm + bill_length_mm + species,
              data = train_data)

  # Predict on test data
  predictions <- predict(model, newdata = test_data)

  # Calculate MSE for this fold
  cv_errors[k] <- mean((test_data$body_mass_g - predictions)^2)
}

# Average across all folds
cv_mse <- mean(cv_errors)
cv_rmse <- sqrt(cv_mse)

cat("5-Fold CV RMSE:", round(cv_rmse, 2), "\n")
cat("Individual fold RMSEs:", round(sqrt(cv_errors), 2), "\n")
Transformations for ANOVA
# Log transformation (for right-skewed data, positive values only)
model_log <- aov(log(Flicker) ~ Colour, data=flicker)
plot(model_log)

# Square root transformation (for count data)
model_sqrt <- aov(sqrt(Flicker) ~ Colour, data=flicker)

# Box-Cox transformation (finds optimal transformation)
library(MASS)
bc <- boxcox(lm(Flicker ~ Colour, data=flicker))
lambda <- bc$x[which.max(bc$y)]
model_bc <- aov(Flicker^lambda ~ Colour, data=flicker)

# After transformation, check diagnostics again!
par(mfrow=c(2,2))
plot(model_bc)
Bartlett’s Test
Another test of equal variances. Unlike Levene’s test, it is sensitive to non-normality.
Compact Letter Display
Groups that share a letter are not significantly different.
Checking Diagnostics for Two-Way ANOVA
Same assumptions apply! Always check before trusting results.
    Shapiro-Wilk normality test

data:  residuals(L1)
W = 0.92213, p-value = 0.003538Levene's Test for Homogeneity of Variance (center = median)
Df F value Pr(>F)
group 11 4.1582 0.0005539 ***
36
---
Signif. codes: 0 '***' 0.001 '**' 0.01 '*' 0.05 '.' 0.1 ' ' 1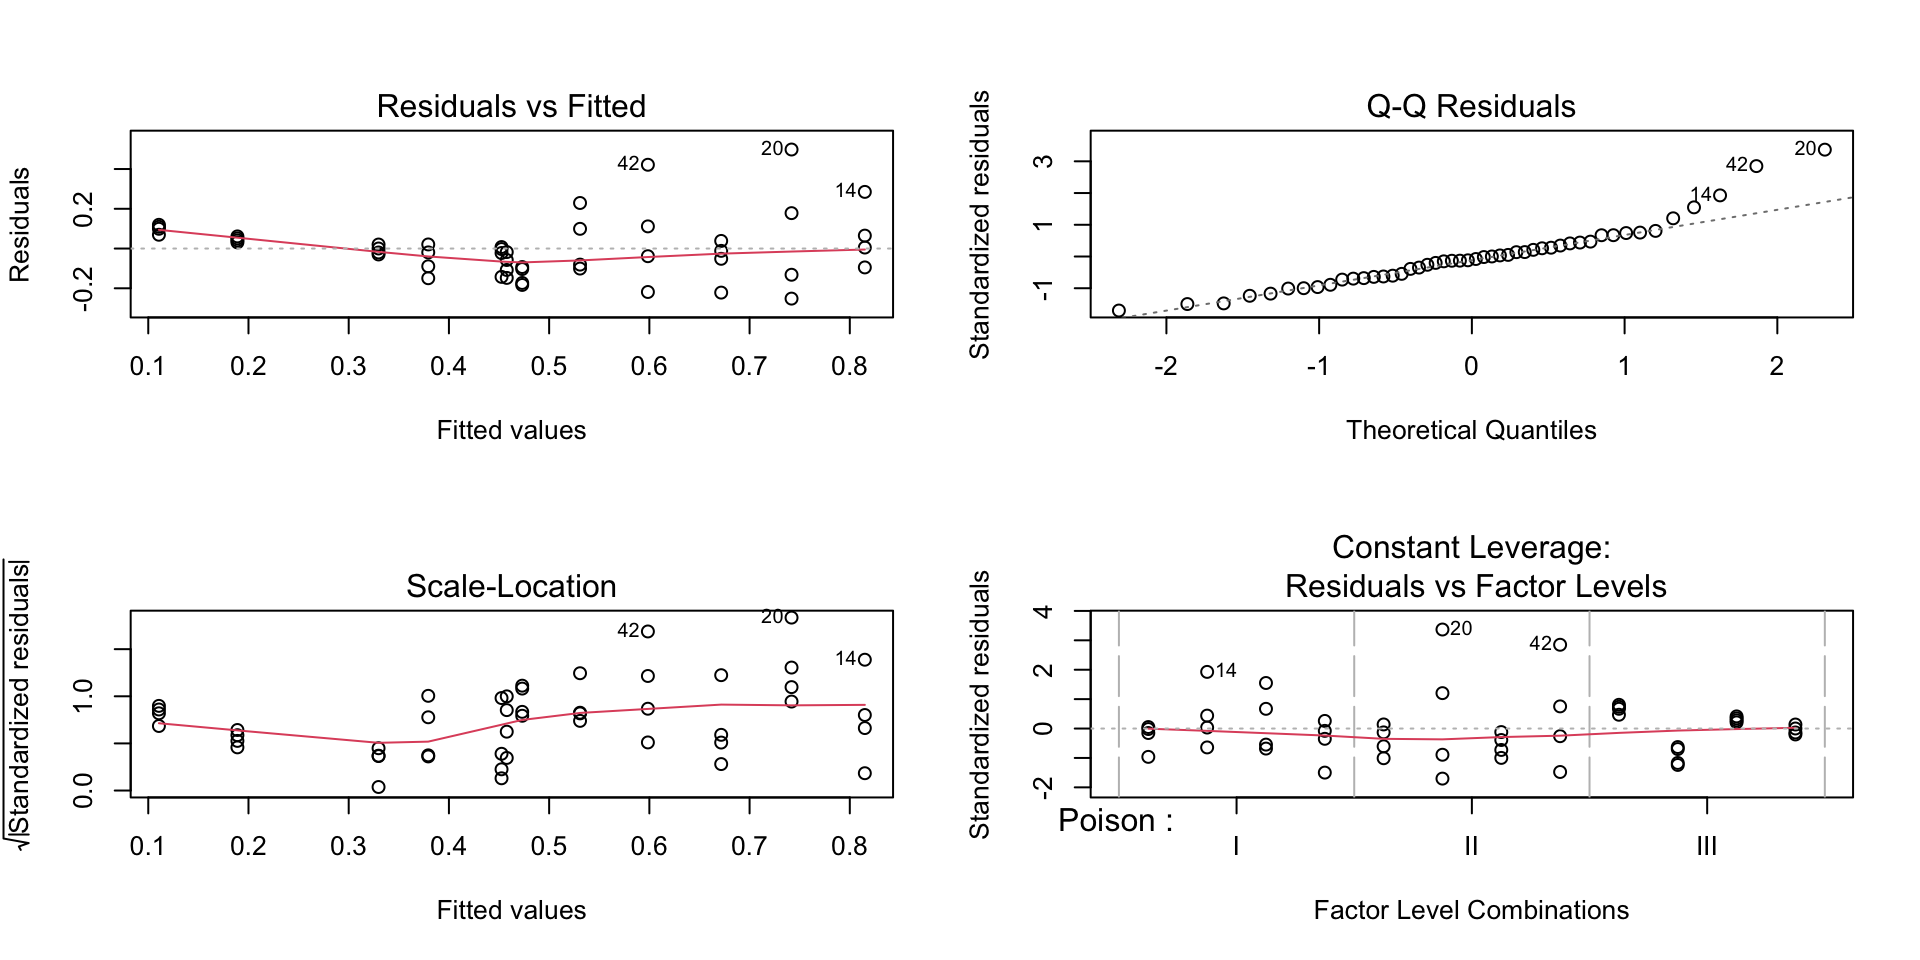

STAT 204 – Intro to Statistical Data Analysis