(polygon[GRID.polygon.1], polygon[GRID.polygon.2], polygon[GRID.polygon.3], polygon[GRID.polygon.4], text[GRID.text.5], text[GRID.text.6], text[GRID.text.7], text[GRID.text.8]) STAT 17: Statistical Methods for Business and Economics
08 Jun 2026
Meet Sofia: Fighting Climate Change 🌍
Sofia is a UCSC environmental studies student working with a campus sustainability organization…
Her mission: Increase student participation in climate action programs
- Bike-sharing program
- Zero-waste dining initiatives
- Community gardens
- Climate justice workshops
The Challenge: With limited resources, how can she predict which students are most likely to participate? 🤔
Today’s goal: Use probability to make strategic decisions about outreach!
What We’ll Accomplish Today
By the end of this lecture, you will be able to:
- ✅ Apply fundamental probability terminology correctly (experiment, outcome, event, sample space)
- ✅ Distinguish between independent and mutually exclusive events
- ✅ Apply the addition rule for probability calculations
- ✅ Apply the multiplication rule for probability calculations
What is Probability? 🎯
Probability measures the likelihood that an event will occur.
Scale: Always between 0 and 1 (or 0% to 100%)
- P = 0: Event is impossible
- P = 0.5: Event is equally likely to occur or not
- P = 1: Event is certain
Sofia’s question: “What’s the probability a randomly selected UCSC student will join our bike-sharing program?”
Why Probability Matters 💡
In real life, we use probability constantly:
- Weather forecasts: “70% chance of rain tomorrow”
- Medical decisions: “This treatment has an 85% success rate”
- Sports predictions: “The team has a 60% chance of winning”
- Education: “Students who attend office hours have a 40% higher pass rate”
- Climate action: “Students living on campus are twice as likely to use bike-sharing”
Probability helps us make informed decisions under uncertainty! 🎲
Fundamental Probability Terminology 📚
- Experiment
- Any process that generates observations or outcomes
- Outcome
- A single result of an experiment
- Sample Space (S)
- The set of all possible outcomes
- Event (E)
- A collection of one or more outcomes (subset of sample space)
Example: Random Student Survey
Sofia’s Experiment: Select one random UCSC student and ask about their climate action participation.
Possible Outcomes:
- Uses bike-sharing
- Participates in zero-waste dining
- Volunteers in community garden
- Attends climate workshops
- None of the above
Sample Space (S): {Bike-sharing, Zero-waste, Garden, Workshops, None}
Event E: “Student participates in at least one program”
E = {Bike-sharing, Zero-waste, Garden, Workshops}
Classical Probability Definition
When all outcomes are equally likely:
\[P(E) = \frac{\text{Number of outcomes in } E}{\text{Total number of outcomes in } S}\]
Example: Roll a fair six-sided die
- Sample Space: S = {1, 2, 3, 4, 5, 6}
- Event E: “Roll an even number” = {2, 4, 6}
- P(E) = 3/6 = 0.5 or 50%
Empirical Probability (Real Data!)
When outcomes are NOT equally likely, we use observed data:
\[P(E) = \frac{\text{Number of times } E \text{ occurred}}{\text{Total number of trials}}\]
Sofia’s real data: She surveyed 500 UCSC students
- 125 use bike-sharing
- 200 participate in zero-waste dining
- 75 volunteer in community garden
- 100 attend workshops
P(Uses bike-sharing) = 125/500 = 0.25 or 25%
Calculating Probabilities from Data
Sofia’s survey results (n = 500 students):
| Program | Count | Probability |
|---|---|---|
| Bike-sharing | 125 | 125/500 = 0.25 |
| Zero-waste dining | 200 | 200/500 = 0.40 |
| Community garden | 75 | 75/500 = 0.15 |
| Climate workshops | 100 | 100/500 = 0.20 |
Question: What’s the probability a random student does NOT use bike-sharing?
Answer: P(No bike-sharing) = 1 - 0.25 = 0.75 or 75%
The Complement Rule 🔄
- Complement of Event E (denoted Ec or E’):
- All outcomes in the sample space that are NOT in E
Complement Rule:
\[P(E^c) = 1 - P(E)\]
Why? The total probability must equal 1:
\[P(E) + P(E^c) = 1\]
Complement Rule Example
Sofia’s data: P(Participates in zero-waste) = 0.40
Find: P(Does NOT participate in zero-waste)
Solution:
P(Does NOT participate) = 1 - P(Participates)
P(Does NOT participate) = 1 - 0.40 = 0.60 or 60%
Interpretation: 60% of students are not currently participating in zero-waste dining - a potential target for outreach! 🎯
📊 THINK-PAIR-SHARE #1 (5 minutes)
Probability Practice with Real Data:
Sofia surveyed 400 students about their primary transportation to campus:
- Walk: 160 students
- Bike: 100 students
- Bus: 80 students
- Car: 60 students
Calculate:
- P(Student bikes to campus)
- P(Student does NOT bike to campus)
- P(Student uses active transportation - walk or bike)
Discuss with a partner: How could Sofia use these probabilities to plan bike infrastructure improvements?
Share your answers in Poll Everywhere!
- P(Student bikes to campus)
- P(Student does NOT bike to campus)
- P(Student uses active transportation - walk or bike)

Types of Events: Introduction 🎲
Sofia needs to understand how events relate to each other:
Two critical concepts:
- Mutually Exclusive Events - Cannot happen at the same time
- Independent Events - One event doesn’t affect the other
Important: These are DIFFERENT concepts! Many students confuse them! ⚠️
Mutually Exclusive Events 🚫
Definition: Two events are mutually exclusive (or disjoint) if they cannot occur at the same time.
\[\text{If } A \text{ and } B \text{ are mutually exclusive: } P(A \text{ and } B) = 0\]
Key insight: If one happens, the other CANNOT happen!
Mutually Exclusive: Examples
Example 1: Student’s primary residence
Event A: “Lives on campus”
Event B: “Lives off campus”
Are they mutually exclusive? YES! ✅
A student cannot live both on AND off campus simultaneously.
Example 2: Student’s participation
Event C: “Uses bike-sharing”
Event D: “Participates in zero-waste dining”
Are they mutually exclusive? NO! ❌
A student can do BOTH! These events can overlap.
Visualizing Mutually Exclusive Events
Venn Diagram - Mutually Exclusive:
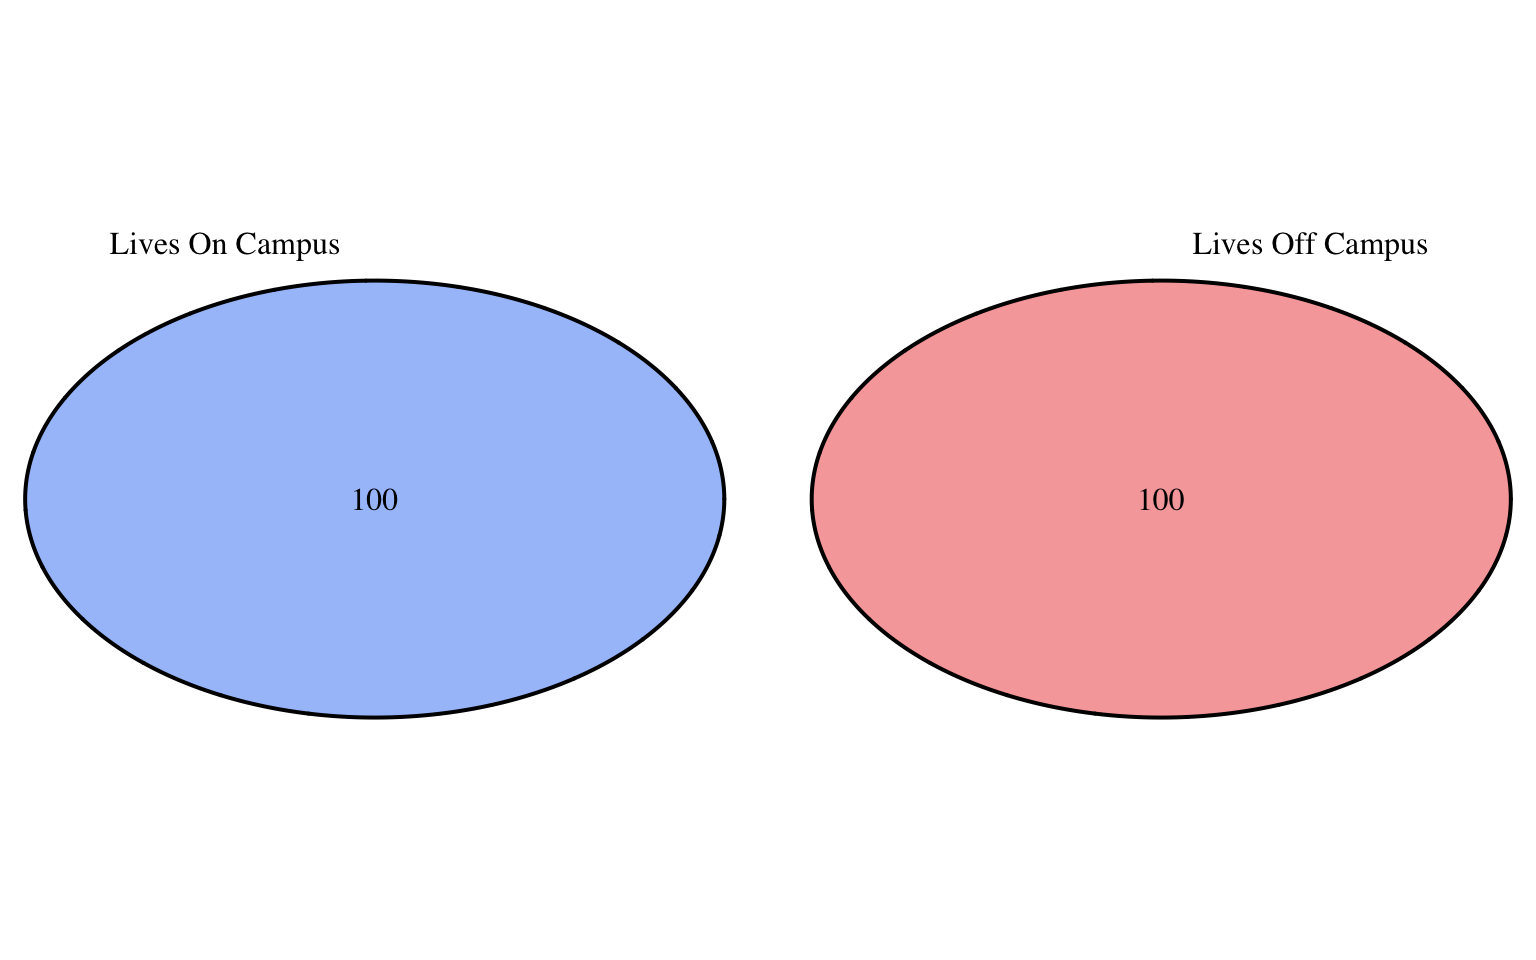
No overlap = Mutually exclusive!
Independent Events 🎯
Definition: Two events are independent if the occurrence of one event does NOT affect the probability of the other event.
\[\text{If } A \text{ and } B \text{ are independent: } P(A \text{ and } B) = P(A) \times P(B)\]
Key insight: Knowing one happened tells you NOTHING about whether the other happened!
Independent: Examples
Example 1: Two different students
Event A: “Student 1 uses bike-sharing”
Event B: “Student 2 uses bike-sharing”
Are they independent? YES! ✅
What Student 1 does doesn’t affect what Student 2 does.
Example 2: Same student, related behaviors
Event C: “Student lives on campus”
Event D: “Student uses bike-sharing”
Are they independent? Probably NO! ❌
Students living on campus might be MORE likely to bike (campus is closer). These events are likely dependent.
Mutually Exclusive vs Independent ⚠️
CRITICAL DISTINCTION:
Mutually Exclusive
- Events cannot occur together
- If A happens, B cannot
- P(A and B) = 0
- About overlap
Example: “Lives on campus” and “Lives off campus”
Independent
- Events do not affect each other
- A happening doesn’t change P(B)
- P(A and B) = P(A) × P(B)
- About influence
Example: Flipping a coin twice - first flip doesn’t affect second
Common Misconception! 🚨
False statement: “If events are mutually exclusive, they must be independent.”
Truth: If events are mutually exclusive, they are DEPENDENT!
Why? If you know A happened, you KNOW B did not happen!
- Knowing A occurred gives you information about B
- Therefore, they are dependent
Exception: If P(A) = 0 or P(B) = 0 (impossible events)
🧘♀️ STRETCH BREAK
Time to move! (5 minutes)
- Stand up and stretch 🤸♀️
- Chat with neighbors 💬
- Grab some water 💧
The Addition Rule 📊
Question: What’s the probability that at least one of two events occurs?
General Addition Rule:
\[P(A \text{ or } B) = P(A) + P(B) - P(A \text{ and } B)\]
Why subtract P(A and B)?
To avoid counting the overlap twice! 🎯
Addition Rule: Mutually Exclusive Case
If A and B are mutually exclusive: P(A and B) = 0
Simplified Addition Rule:
\[P(A \text{ or } B) = P(A) + P(B)\]
Example: Student’s primary residence
- P(Lives on campus) = 0.65
- P(Lives off campus) = 0.35
- P(Lives on campus OR off campus) = 0.65 + 0.35 = 1.00 ✅
Makes sense! Every student lives somewhere.
Addition Rule: General Case
Example: Sofia’s survey (n = 500)
- 125 use bike-sharing
- 200 participate in zero-waste dining
- 50 do BOTH
Find: P(Student uses bike-sharing OR participates in zero-waste)
Solution:
P(Bike OR Zero-waste) = P(Bike) + P(Zero-waste) - P(Both)
= 125/500 + 200/500 - 50/500
= 0.25 + 0.40 - 0.10
= 0.55 or 55%
Visualizing the Addition Rule
Venn Diagram - With Overlap:
(polygon[GRID.polygon.9], polygon[GRID.polygon.10], polygon[GRID.polygon.11], polygon[GRID.polygon.12], text[GRID.text.13], text[GRID.text.14], text[GRID.text.15], text[GRID.text.16], text[GRID.text.17]) 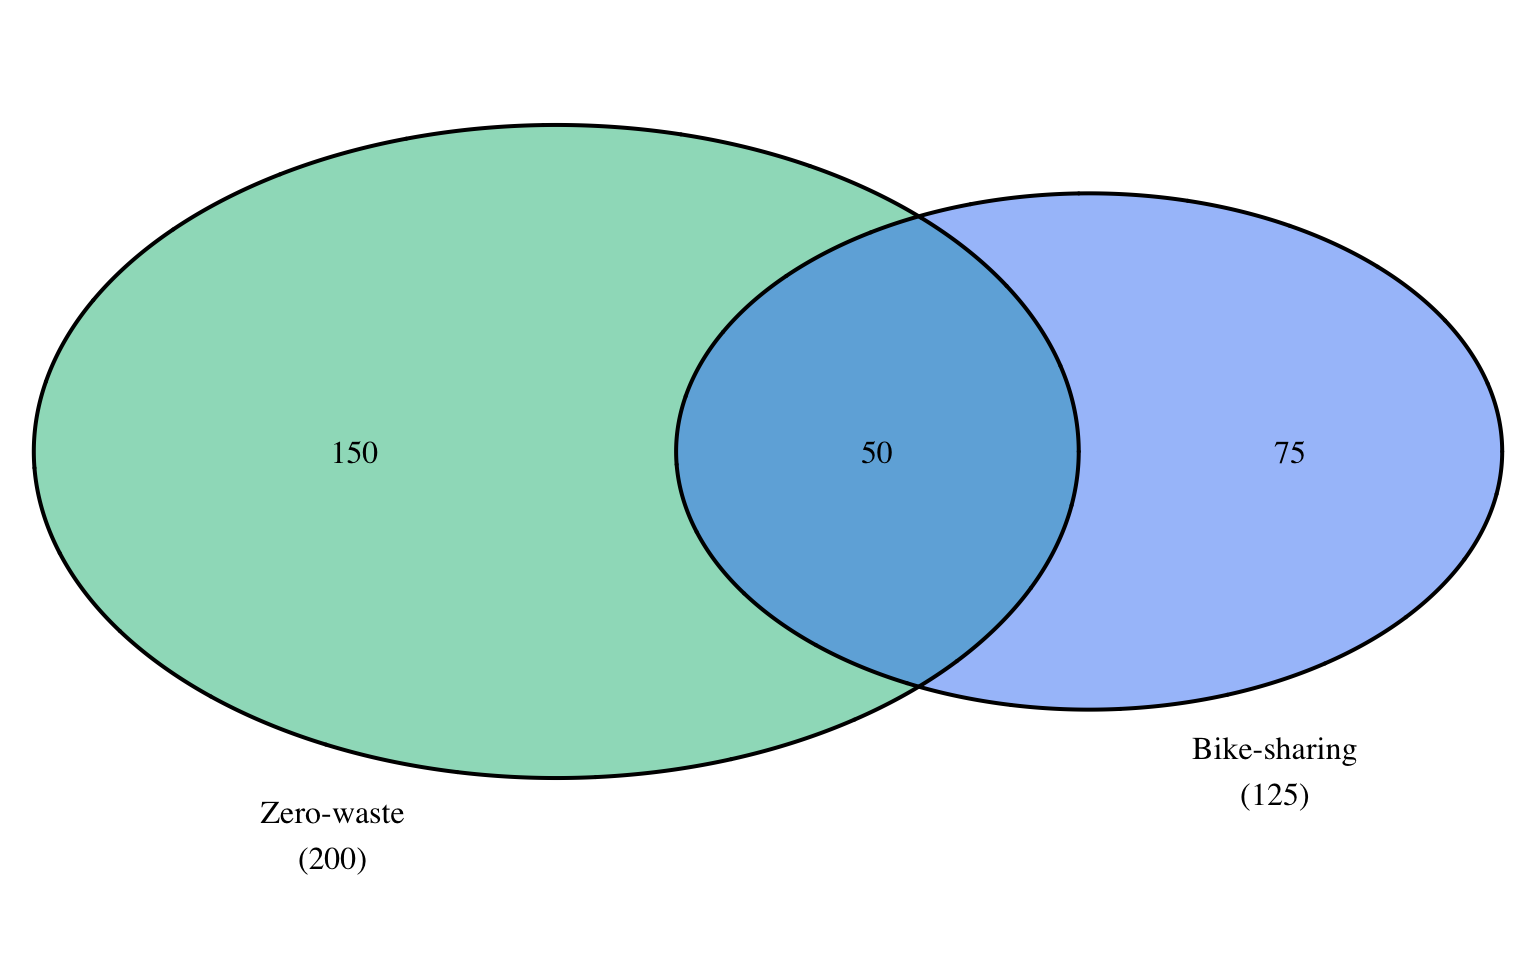
Green + Blue + Overlap (counted once) = Total students doing at least one!
Addition Rule Practice
Sofia’s expanded data (n = 800 students):
- 240 use bike-sharing: P(B) = 240/800 = 0.30
- 320 participate in zero-waste: P(Z) = 320/800 = 0.40
- 80 do both: P(B and Z) = 80/800 = 0.10
Verify with Addition Rule:
P(B or Z) = 0.30 + 0.40 - 0.10 = 0.60
Check: 240 + 320 - 80 = 480 students
480/800 = 0.60 ✅
The Multiplication Rule 🎲
Question: What’s the probability that both of two events occur?
General Multiplication Rule:
\[P(A \text{ and } B) = P(A) \times P(B|A)\]
Where P(B|A) means “probability of B given that A occurred”
For independent events, this simplifies!
Multiplication Rule: Independent Case
If A and B are independent: P(B|A) = P(B)
Simplified Multiplication Rule:
\[P(A \text{ and } B) = P(A) \times P(B)\]
Example: Two random students
- P(Student 1 uses bike-sharing) = 0.25
- P(Student 2 uses bike-sharing) = 0.25
P(Both use bike-sharing) = 0.25 × 0.25 = 0.0625 or 6.25%
Multiplication Rule: Multiple Events
For three independent events:
\[P(A \text{ and } B \text{ and } C) = P(A) \times P(B) \times P(C)\]
Example: Three random students
P(All three use bike-sharing) = 0.25 × 0.25 × 0.25 = 0.0156 or 1.56%
Notice: As we add more independent events, the probability of ALL occurring gets smaller! 📉
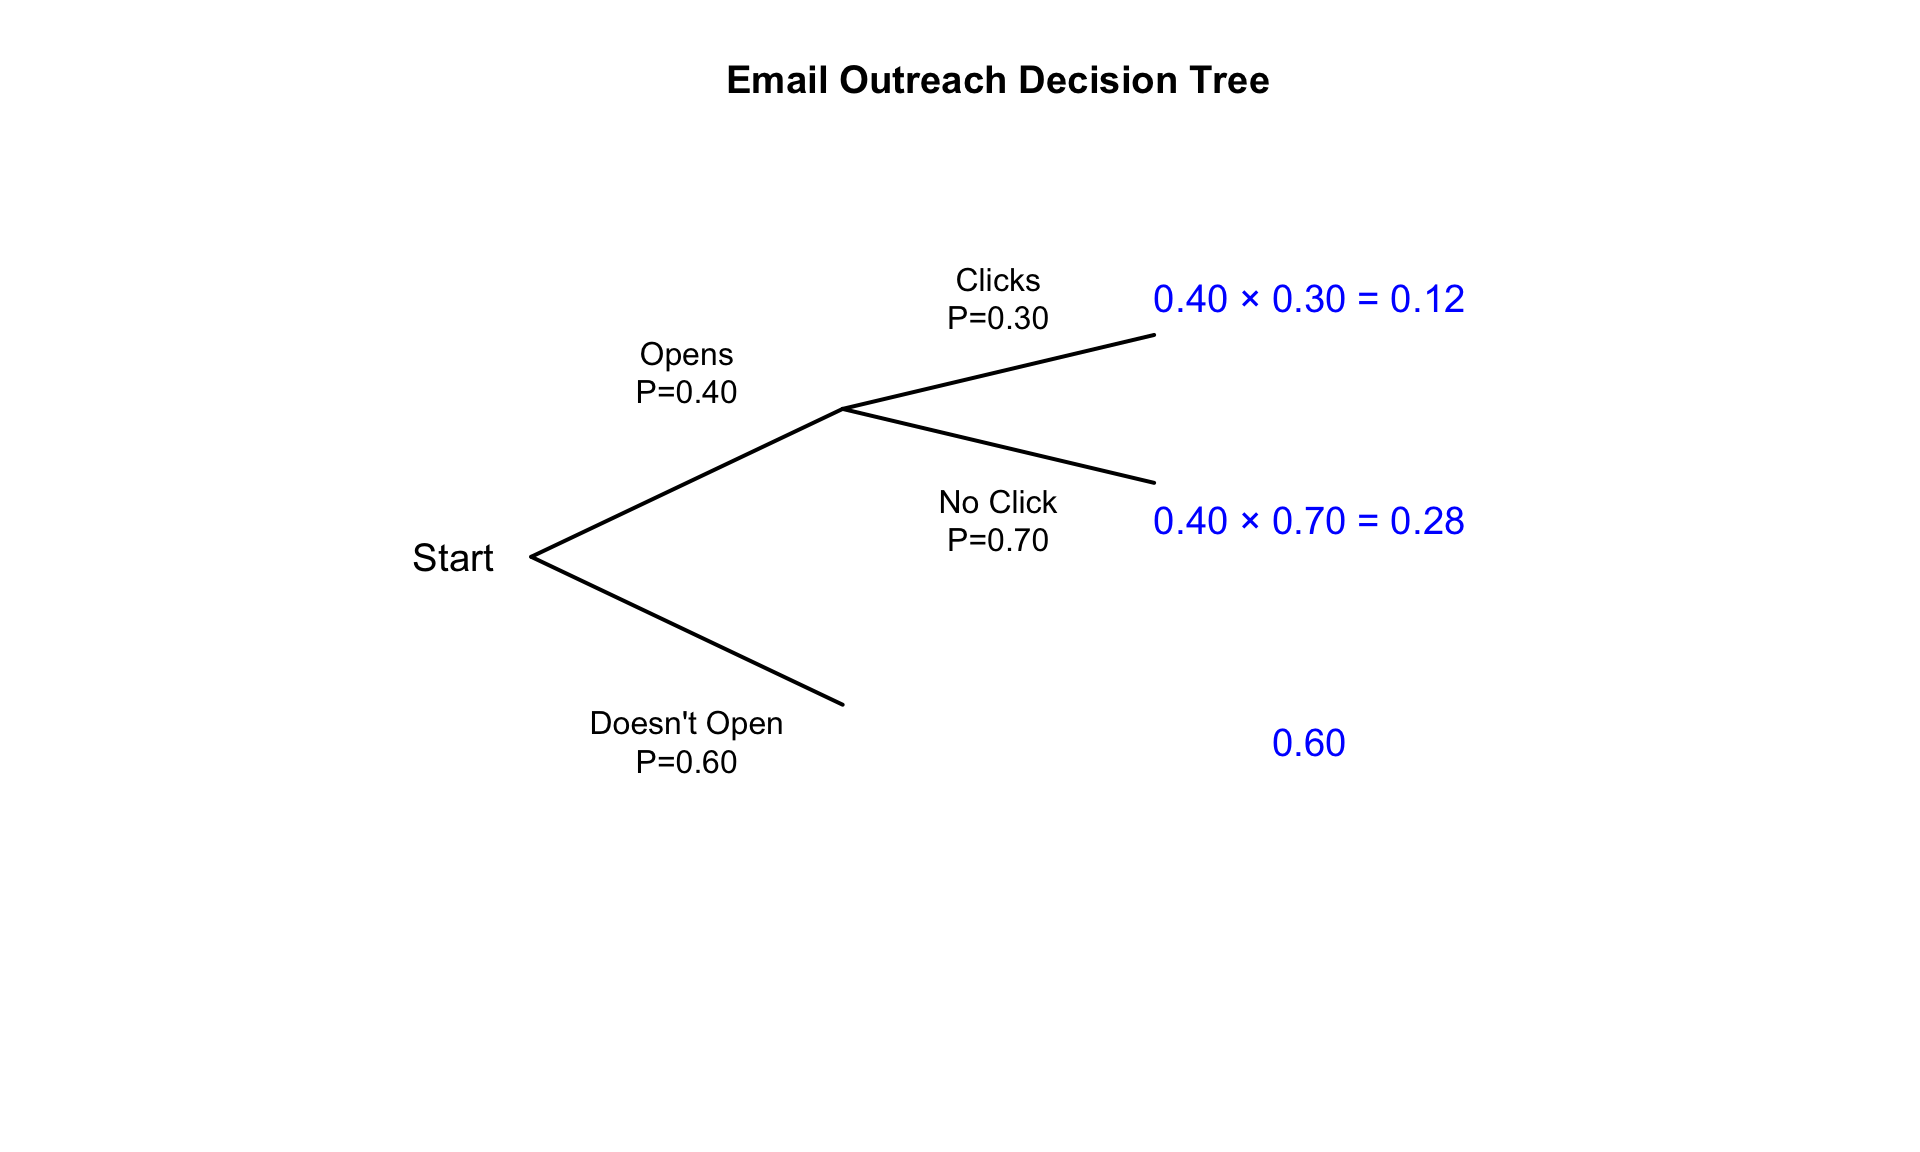
Multiplication Rule Application
Sofia’s outreach strategy:
She sends emails to students. From past data:
- P(Student opens email) = 0.40
- P(Student clicks link | opened email) = 0.30
- These are independent? NO! Must have opened to click.
Find: P(Student opens email AND clicks link)
Solution:
P(Opens and Clicks) = P(Opens) × P(Clicks | Opens)
= 0.40 × 0.30 = 0.12 or 12%
When to Use Which Rule? 🤔
Addition Rule
Use when finding: “A OR B”
- P(at least one occurs)
- P(either one happens)
Formula:
P(A or B) = P(A) + P(B) - P(A and B)
If mutually exclusive:
P(A or B) = P(A) + P(B)
Multiplication Rule
Use when finding: “A AND B”
- P(both occur)
- P(all happen together)
Formula:
P(A and B) = P(A) × P(B|A)
If independent:
P(A and B) = P(A) × P(B)
📊 THINK-PAIR-SHARE #2 (7 minutes)
Real-World Probability Challenge:
Sofia’s climate action survey (n = 600):
- 180 students are first-generation college students
- 240 students live on campus
- 90 students are BOTH first-gen AND live on campus
Tasks:
- Calculate P(First-gen OR Lives on campus) using the addition rule
- Are “first-gen” and “lives on campus” mutually exclusive? Why or why not?
- If these events were independent, what would P(First-gen AND Lives on campus) be? Compare to the actual value (90/600 = 0.15).
- What does this tell Sofia about targeting her outreach?
Post your analysis on Ed Discussion with your group members’ names!
Real Applications for Sofia 🌱
Using probability to improve outreach:
Finding 1: P(Uses bike-sharing | Lives on campus) = 0.35
P(Uses bike-sharing | Lives off campus) = 0.12
Action: Focus bike infrastructure near dorms! 🚲
Finding 2: P(Attends workshop AND volunteers in garden) = 0.05
P(Attends workshop) × P(Garden volunteer) = 0.20 × 0.15 = 0.03
Insight: These activities are NOT independent - students who do one are more likely to do the other! Create combined programs! 🌿
Summary: Probability Rules
Key Formulas:
Complement Rule: \[P(E^c) = 1 - P(E)\]
Addition Rule (for A or B): \[P(A \text{ or } B) = P(A) + P(B) - P(A \text{ and } B)\]
If mutually exclusive: P(A or B) = P(A) + P(B)
Multiplication Rule (for A and B): \[P(A \text{ and } B) = P(A) \times P(B|A)\]
If independent: P(A and B) = P(A) × P(B)
Calculating Probabilities in Google Sheets 💻
Example dataset in columns A-C:
| Student ID | Uses Bike | Zero-Waste |
|---|---|---|
| 1 | Yes | Yes |
| 2 | No | Yes |
| … | … | … |
Count events:
=COUNTIF(B:B, "Yes")- counts bike users=COUNTIFS(B:B, "Yes", C:C, "Yes")- counts both
Calculate probability:
=COUNTIF(B:B, "Yes")/COUNTA(B:B)- P(Bike)
Decision Trees for Complex Probabilities 🌳
Visual tool for sequential events:
Common Probability Mistakes ⚠️
- Confusing mutually exclusive with independent - they’re opposite concepts!
- Forgetting to subtract overlap in addition rule when events aren’t mutually exclusive
- Assuming independence when events are related (must verify!)
- Adding probabilities when you should multiply (mixing up AND vs OR)
- Probabilities > 1 - always check! Probabilities must be between 0 and 1
Sofia’s Success Story! 🎉
How probability transformed her outreach:
✅ Targeted campaigns: Focused on on-campus students for bike-sharing (35% participation vs 12% off-campus)
✅ Bundle programs: Created combined workshop + garden volunteer events (since they’re not independent!)
✅ Realistic goals: Expected 12% email click rate instead of overestimating
✅ Impact: Increased overall climate action participation by 28% in one semester! 🌱
Your Probability Toolkit 🧰
Fundamental Concepts:
- Sample space = all possible outcomes
- Event = subset of sample space
- P(E) = number of favorable outcomes / total outcomes
- Complement: P(Ec) = 1 - P(E)
Event Types:
- Mutually exclusive: Cannot happen together, P(A and B) = 0
- Independent: Don’t affect each other, P(A and B) = P(A) × P(B)
Calculation Rules:
- Addition (OR): P(A or B) = P(A) + P(B) - P(A and B)
- Multiplication (AND): P(A and B) = P(A) × P(B) if independent
Looking Ahead
Next Class: Conditional Probability and Contingency Tables
- Understanding P(A|B)
- Contingency tables and simple, marginal and joint probability
This week’s assignment: Analyze probability scenarios using real campus data! 📊
Questions? Probability can be tricky - office hours are here to help! 🤝
Quick Knowledge Check ✅
Rate your confidence (1-5) on Ed Discussion:
- Applying probability terminology correctly ⭐⭐⭐⭐⭐
- Distinguishing between mutually exclusive and independent events ⭐⭐⭐⭐⭐
- Using the addition rule correctly ⭐⭐⭐⭐⭐
- Using the multiplication rule correctly ⭐⭐⭐⭐⭐
- Solving real-world probability problems ⭐⭐⭐⭐⭐
If you rated anything 3 or below, please visit office hours! 🤗
Thank you! 🎲✨
Questions? Office hours information on Canvas.
Next up: Conditional Probability & Bayes’ Theorem!
![]()
STAT 17 – Fall 2025