STAT 17: Statistical Methods for Business and Economics
08 Jun 2026
The Netflix Recommendation Mystery 🎬
2019: Netflix has 167 million subscribers worldwide.
Sarah, a marketing specialist, notices something puzzling…
- Some users love their recommendations
- Others complain Netflix “doesn’t understand them at all”
- The algorithm seems to work differently for different groups
Today’s mission: Follow Sarah’s statistical detective story and learn the fundamental concepts that helped her solve this mystery!
What We’ll Accomplish Today
By the end of this lecture, you will be able to:
- ✅ Define statistics, probability, population, sample, parameter, and statistic
- ✅ Distinguish between different sampling methods and their applications
- ✅ Identify different types of variables and apply them to problems
- ✅ Design ethical experiments and understand research ethics
- ✅ Recognize sources of bias in data collection
Key Definitions
What is Statistics?
Statistics is the science of collecting, organizing, analyzing, and interpreting data to make informed decisions.
Think of it as Sarah’s toolbox for understanding Netflix users! 🧰
Core Definitions
- Population
- All individuals, objects, or measurements whose properties are being studied
Sarah’s case: All 167 million Netflix subscribers worldwide
- Sample
- A subset of the population studied
Sarah’s case: The 50,000 users she actually studies
Core Definitions
- Parameter
- A number that represents a population characteristic (usually unknown)
Sarah’s case: The true average satisfaction rating of ALL Netflix users
- Statistic
- A numerical characteristic of the sample; estimates the population parameter
Sarah’s case: The average satisfaction rating from her 50,000 users
One More Key Definition
- Probability
- A number between 0 and 1 that gives the likelihood of a specific event
Sarah’s case: The probability that a user will watch a recommended movie
- 0 = Event will never happen
- 0.5 = Event happens half the time
- 1 = Event will always happen
🔄 THINK-PAIR SHARE #1 (5 minutes)
Your Turn: Work with a partner and identify the following:
“A YouTuber wants to understand running habits from their subscribers. They survey 2,000 subscribers from their 15 million total users about their average daily running time. The survey shows subscribers run an average of 1.3 hours daily.”
Identify:
- Population: _______________ 2. Sample: _______________
- Parameter: _______________ 4. Statistic: _______________
Discussion: Share your answers in Poll Everywhere!
Share your answers in Poll Everywhere!
Identify:
- Population: _______________ 2. Sample: _______________
- Parameter: _______________ 4. Statistic: _______________
Types of Variables
Back to Sarah’s Story…
Sarah realizes she needs to collect different types of information about users.
Variable: A characteristic of interest for each person or object in a population
Categorical Variables (Qualitative Data)
Variables that take on values that are names or labels
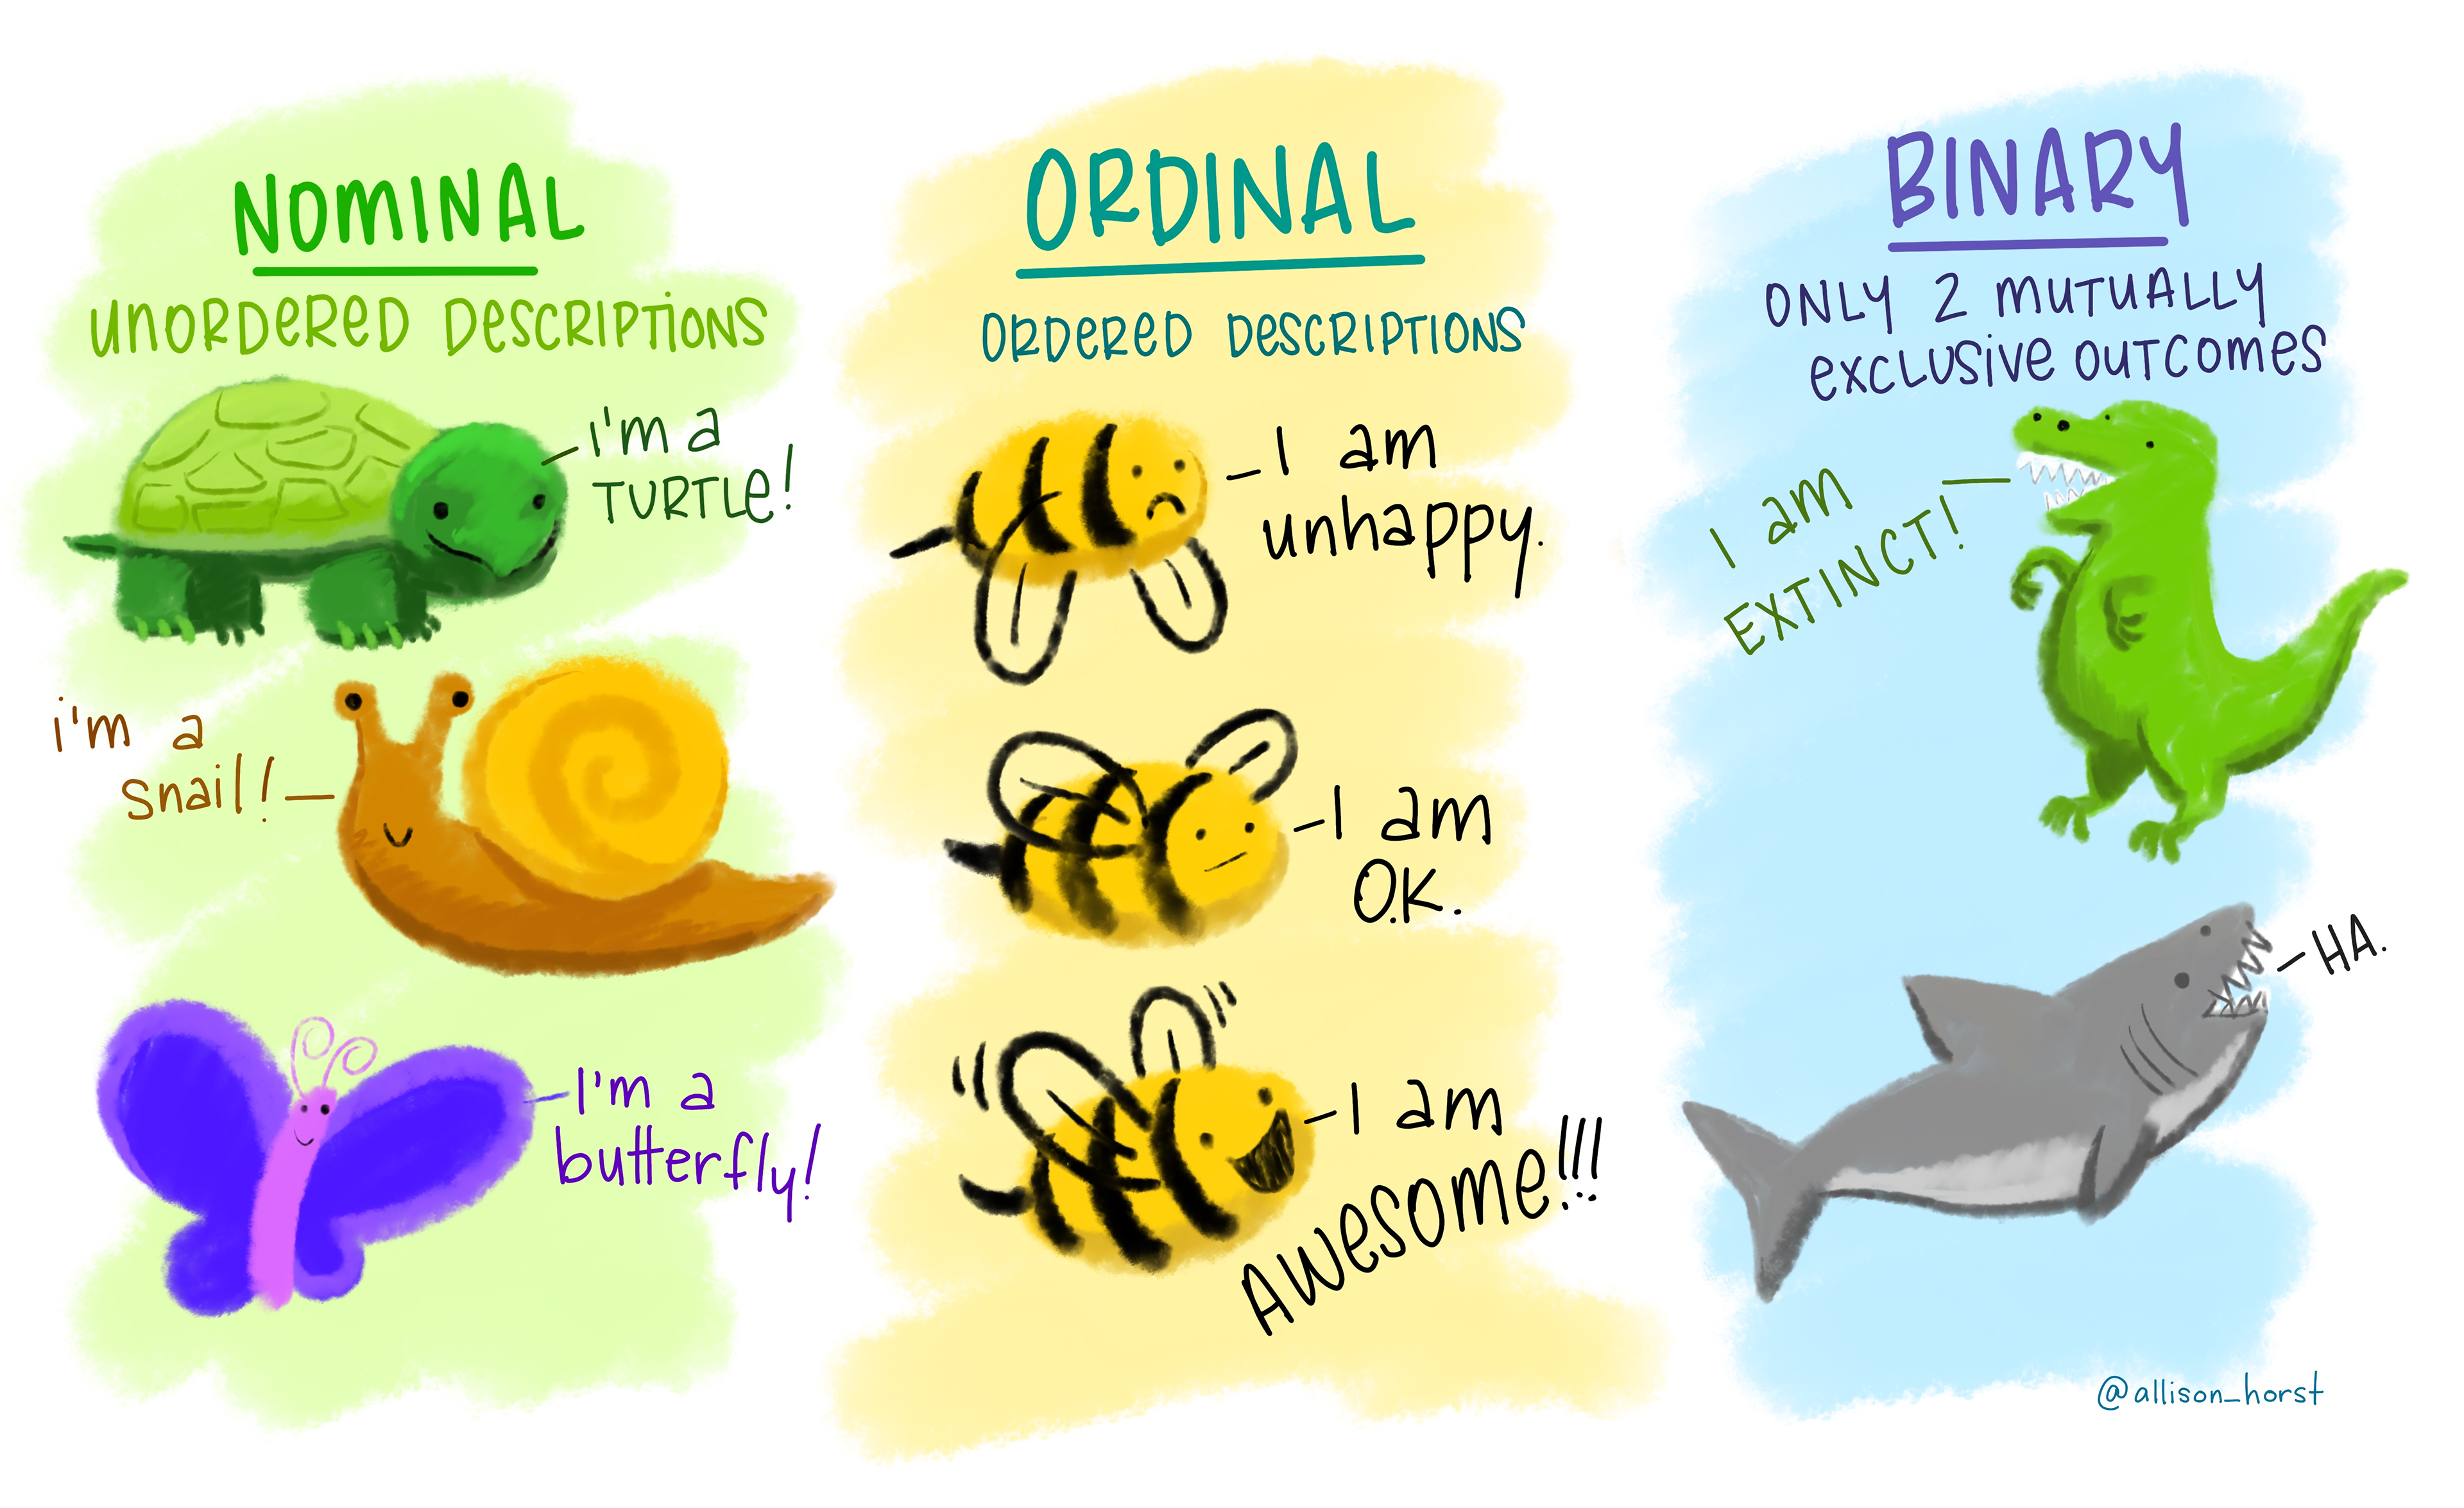
Categorical Variables (Qualitative Data)
Examples from Netflix:
Preferred genre (Comedy, Drama, Horror)
Subscription type (Basic, Standard, Premium)
Are you happy with your Netflix recommendations? (Always, Most of the time, Sometimes, Rarely, Never)
Are you sharing your Netflix account now? (Yes/No)
Numerical Variables (Quantitative Data)
Variables that take on values indicated by numbers
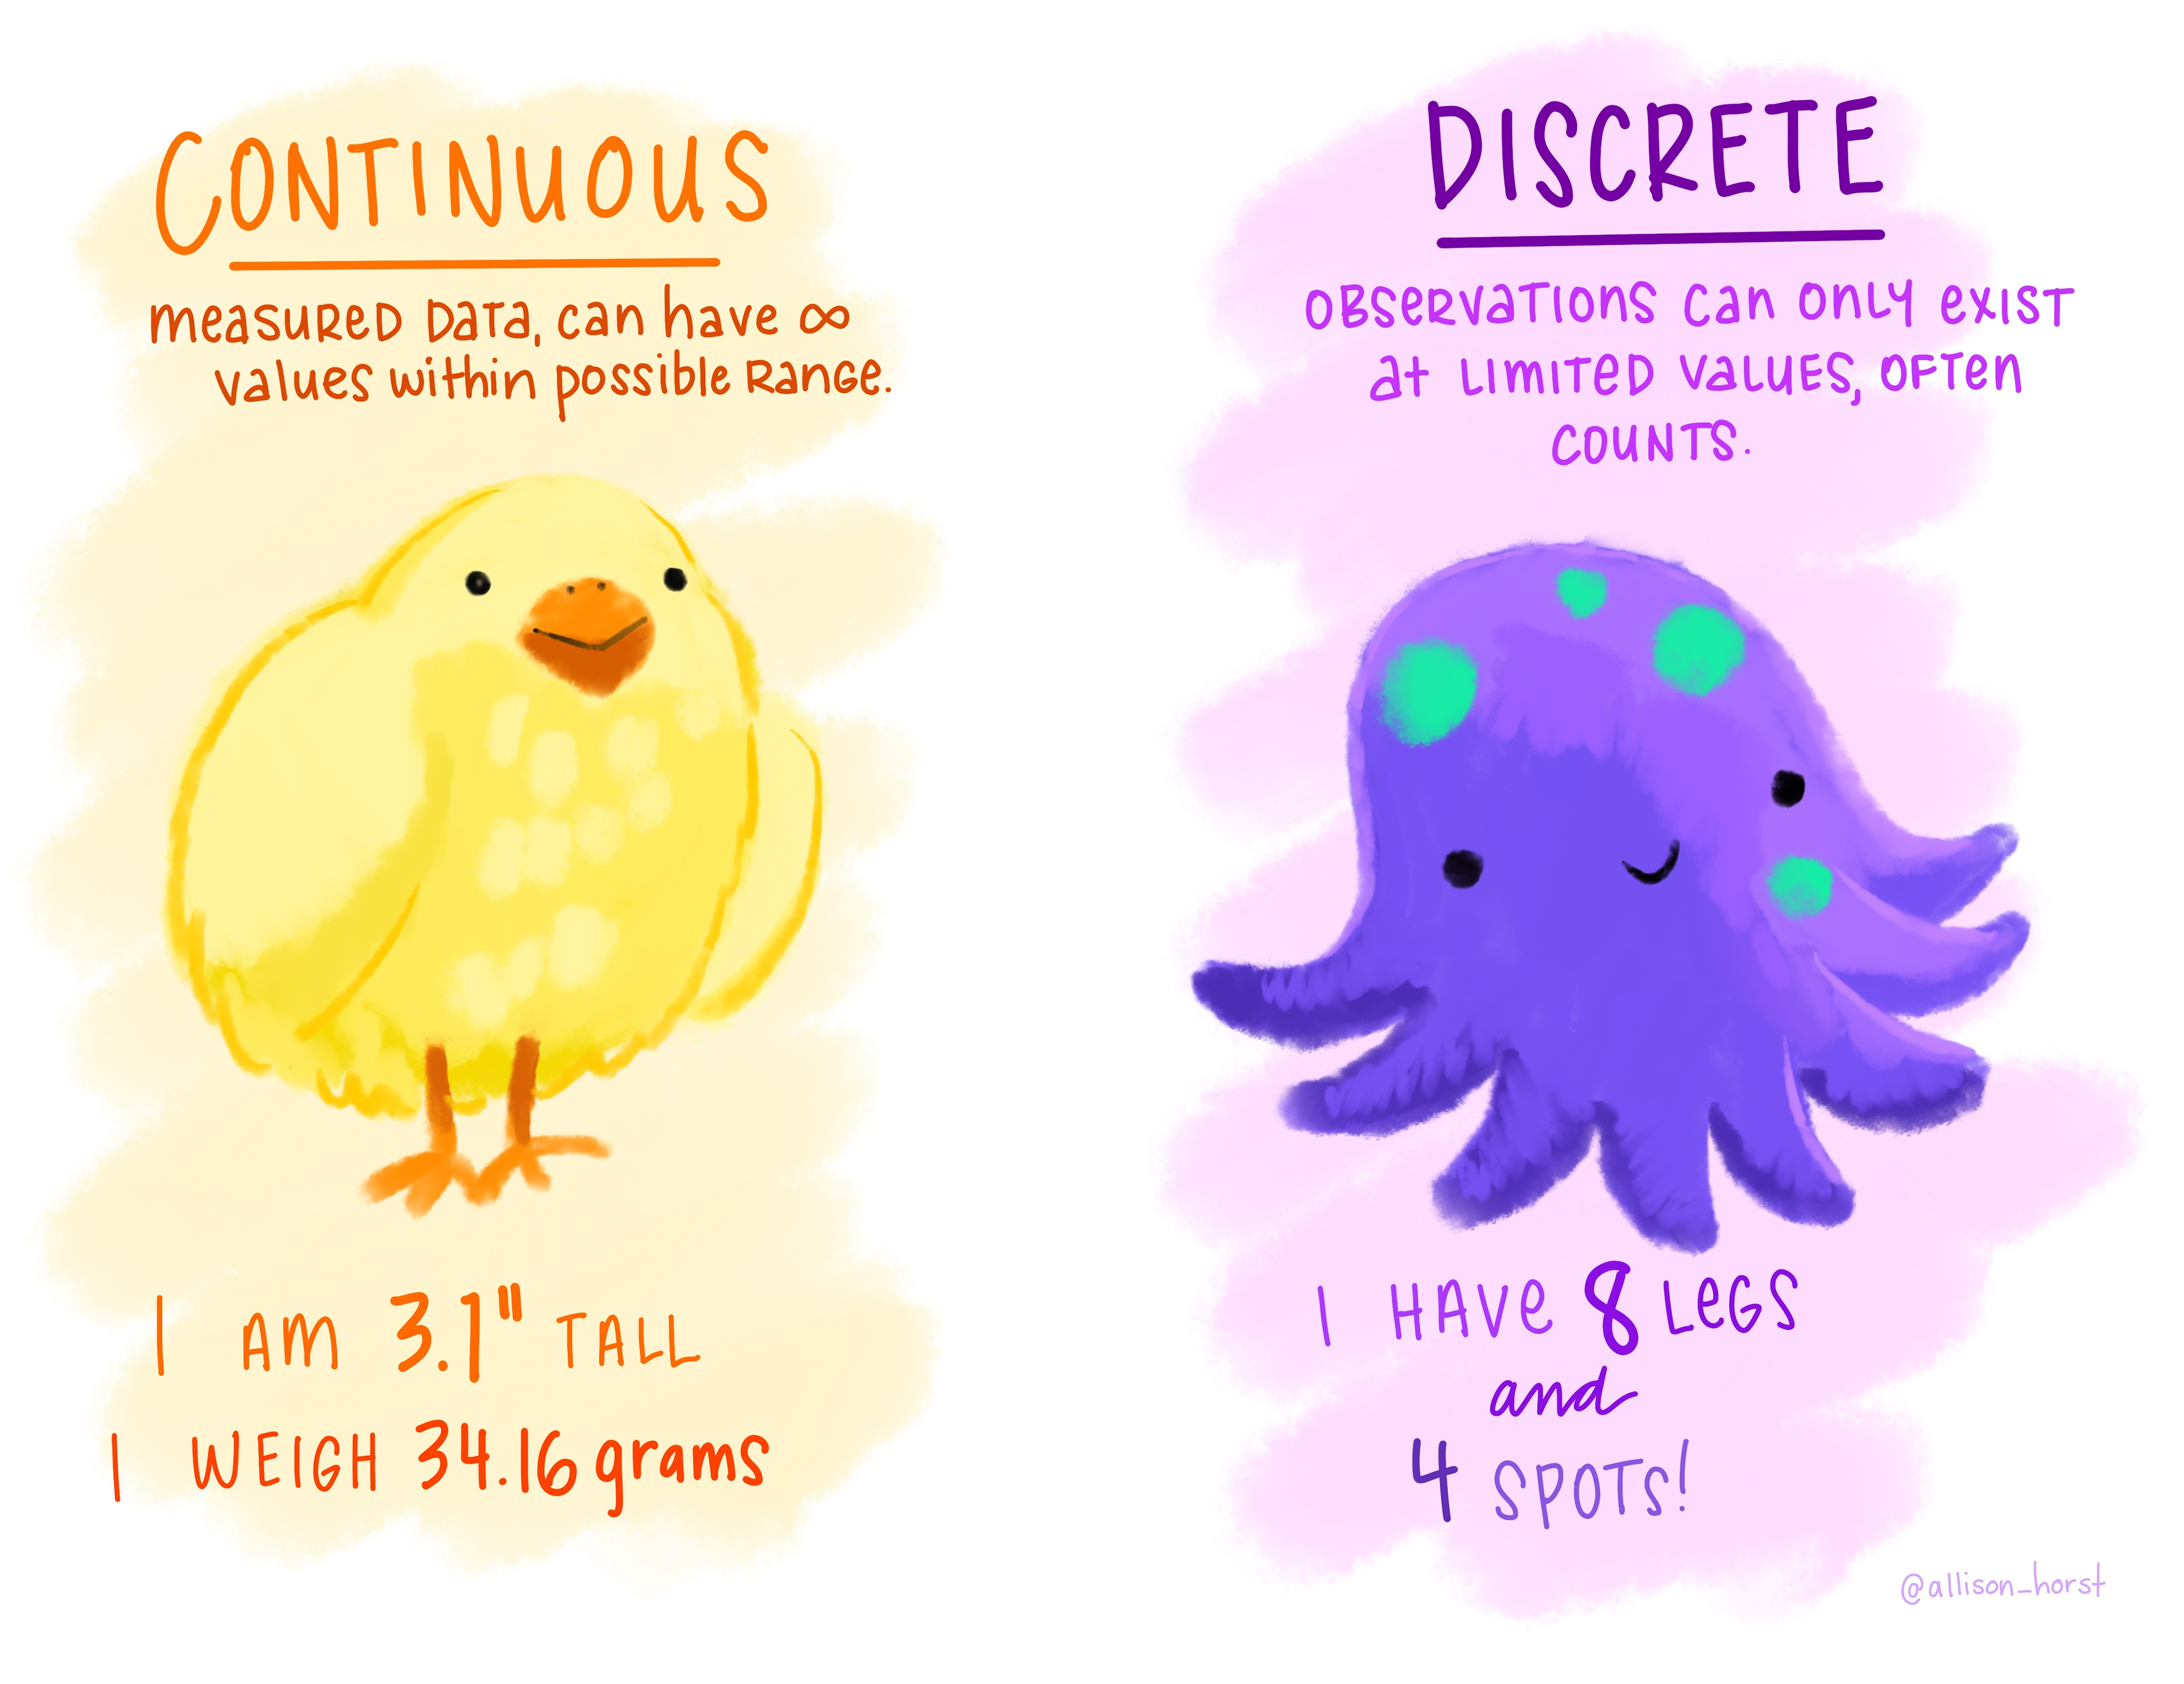
Numerical Variables (Quantitative Data)
Variables that take on values indicated by numbers
Discrete
Result of counting (whole numbers)
Hours watched per week: 0, 1, 2, 3…
Number of shows in watchlist: 5, 12, 47…
Continuous
Result of measuring (can be any value)
Time spent browsing: 12.7 minutes
User satisfaction rating: 3.8/5.0
🔄 THINK-PAIR SHARE #2 (5 minutes)
Classify each variable as: Categorical Nominal, Categorical Ordinal, Categorical Binary, Discrete Numerical, or Continuous Numerical
- Number of movies watched last month: _______________
- Favorite streaming platform: _______________
- Download speed in Mbps: _______________
- Sharing the account (Yes/No): _______________
- Time spent watching per day (in hours): _______________
- Satisfaction scale (Always, Most of the time, Sometimes, Rarely, Never): _______________
Discussion: Share your answers in Poll Everywhere!
Share your answers in Poll Everywhere!
Classify each variable as: Categorical Nominal, Categorical Ordinal, Categorical Binary, Discrete Numerical, or Continuous Numerical
- Sharing the account (Yes/No): _______________
- Time spent watching per day (in hours): _______________
- Satisfaction scale (Always, Most of the time, Sometimes, Rarely, Never): _______________
Sampling Methods:
How Sarah Gathers Data
- The Challenge
Sarah can’t survey all 167 million users.
How does she choose who to study? 🤔
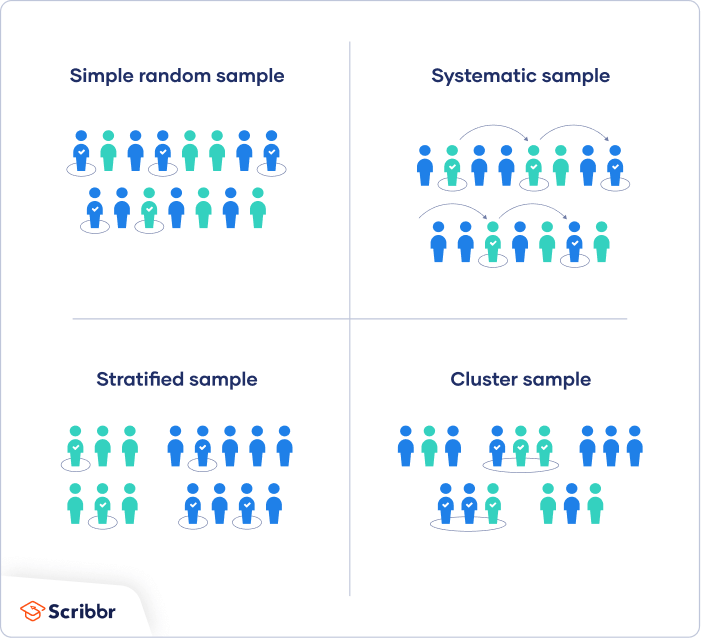
1. Simple Random Sampling
Give each population member a number, then randomly select
Netflix Example: Randomly select 2,000 user IDs from the database
Pros ✅ - Unbiased - Every member has equal chance
Cons ❌ - May not represent subgroups well
2. Systematic Sampling
Select every kth individual from a list
Netflix Example: Select every 83,500th subscriber
(167M ÷ 2,000 = 83,500)
Pros ✅ - Easy to implement - Spreads sample across population
Cons ❌ - Can introduce bias if there’s a pattern
3. Stratified Sampling
Divide population into groups (strata), then randomly sample from each
Netflix Example: Sample proportionally from each country/age group
Pros ✅ - Ensures representation of subgroups
Cons ❌ - Requires knowledge of population characteristics
4. Cluster Sampling
Divide population into clusters, randomly select clusters, include all members
Netflix Example: Randomly select cities, then survey ALL users in those cities
Pros ✅ - Practical when populations are geographically spread
Cons ❌ - Members within clusters may be similar
5. Convenience Sampling ⚠️
Select individuals that are easily accessible
Netflix Example: Survey users who respond to an email invitation
Pros ✅ - Quick and cheap
Cons ❌ - Often biased - Not representative
🔄 THINK-PAIR SHARE #3
Sampling Method Design Challenge (7 minutes)
Scenario: You’re studying student satisfaction with campus dining services.
Work in Groups of 3-4:
- Design a sampling strategy using one of the methods we discussed
- Justify your choice: Why is this method best?
- Identify potential problems with your chosen method
- Suggest one alternative method and compare
1 person from the group shares on Ed Discusssion your sampling strategy in 1 paragraph and add the names of your groups memebers on the post!
🧘♀️ STRETCH BREAK
Time to move! (5 minutes)
- Stand up and stretch 🤸♀️
- Chat with neighbors 💬
- Grab some water 💧
When we return: Research ethics and bias - crucial for Sarah’s investigation!
Research Ethics and Experimental Design
Sarah’s Ethical Dilemma
Sarah wants to test if changing the recommendation algorithm improves user satisfaction.
But she faces ethical considerations… 🤔
Key Ethical Principles
- Informed Consent: Participants should know they’re in a study
- Do users need to know their recommendations are part of an experiment?
- Do No Harm: Research shouldn’t negatively impact participants
- What if the experimental algorithm gives poor recommendations?
- Privacy and Confidentiality: Protect participant data and identity
- Viewing habits are personal information
- Voluntary Participation: Participants can withdraw at any time
- Users should be able to opt out
Experimental Design Components
- Experimental Unit
- Individual or object to be measured
- Individual Netflix users
- Explanatory Variable
- Independent variable controlled by researchers
- Type of recommendation algorithm
- Response Variable
- Dependent variable measured for change
- User satisfaction scores
- Control Group
- Group receiving inactive/standard treatment
- Users receiving current algorithm
- Treatments
- Different values of explanatory variable
- Current vs. New algorithm
- Random Assignment
- Organizing subjects into groups randomly
- Randomly assigning users to algorithms
Blinding Methods
- Blinding
- Not telling participants which treatment they receive
- Double-blind
- Neither participants nor researchers know treatment assignment
Netflix example: Users don’t know which algorithm they’re using; customer service reps evaluating satisfaction don’t know either
Sources of Bias: What Could Go Wrong?
Sarah’s Bias Concerns
Even with careful planning, Sarah must watch for bias that could mislead her conclusions.
Bias can sneak in everywhere! 🕵️♀️
1. Sampling Bias
Not all population members are equally likely to be selected
Example: Only surveying users who respond to emails (active users bias)
Impact: Results don’t represent all Netflix users
2. Nonsampling Error
Issues affecting reliability beyond natural variation:
- Poor Study Design: Confusing or leading questions
- Inaccurate Information: Participants misremember or give socially desirable answers
- Data Entry Errors: Mistakes in recording or system glitches
3. Confounding (lurking) Variables
Variables affecting the study that aren’t explanatory or response variables
Example: Time of year (people watch differently during holidays)
Impact: Makes it seem like algorithm changes caused differences when they didn’t
4. Response Bias
- Self-selection: Only certain types of people respond to surveys
- Non-response: High proportion of people don’t participate
The Placebo Effect
- Placebo
- Inactive treatment that can’t directly affect the response
Netflix example: Telling users they have a “new improved system” when nothing changed
Why it matters: People may report higher satisfaction just because they think something improved
🔄 THINK PER SHARE #4
Bias Detective Challenge (8 minutes)
Read each scenario and identify potential sources of bias
Scenario 1: “A university emails a survey about online learning satisfaction to all 10,000 students and receives 500 responses.”
Scenario 2: “A coffee shop owner asks customers who visit between 2-4 PM on weekdays about roast preference.”
For Each: (1) Identify bias type(s), (2) Explain impact, (3) Suggest improvements
Individual → Partner → Poll Everywhere (3+3+2 min)
Share your answers in Poll Everywhere!
Scenario 2: “A coffee shop owner asks customers who visit between 2-4 PM on weekdays about roast preference.” (1) Identify bias type(s), (2) Explain impact, (3) Suggest improvements
Sarah’s Success Story
How Sarah Solved the Netflix Mystery
- Defined her population clearly (active subscribers in different regions)
- Used stratified sampling to ensure demographic representation
- Identified key variables: viewing time (continuous), genre preference (categorical), satisfaction (ordinal scale)
- Designed ethical experiments with proper consent and random assignment
- Controlled for bias by using double-blind testing and accounting for seasonality
The Results! 🎉
Sarah discovered: Recommendation accuracy varied by cultural context - the algorithm needed regional customization!
The Impact:
Netflix improved user satisfaction by 23%
Reduced subscription cancellations by 15%
Estimated annual savings: $15+ million
Your Statistical Toolkit 🧰
Remember the Fundamentals:
- Statistics helps us make sense of data and uncertainty
- Populations vs samples, parameters vs statistics - know the difference!
- Probability quantifies uncertainty (0 to 1)
Variable Mastery:
- Categorical: Names/labels (favorite genre)
- Numerical: Numbers that are discrete (counted) or continuous (measured)
Your Statistical Toolkit (continued)
Sampling Wisdom:
- Random sampling reduces bias
- Stratified ensures representation
- Convenience is tempting but dangerous
Research Ethics Matter:
- Protect participants through informed consent
- Use proper experimental design with control groups
- Watch for lurking variables and bias
Bias Awareness:
- Sampling bias: Who’s missing from your sample?
- Nonsampling error: What could go wrong in data collection?
- Response bias: Are people telling you the truth?
Looking Ahead
Next Class: We’ll explore descriptive statistics and learn how to summarize and visualize data - the next step in Sarah’s journey! 📊
Homework Preview: You’ll design a sampling strategy for a real-world scenario and identify potential biases.
Questions? This is your foundation for statistical thinking - make sure you’re comfortable with these concepts! 🤔
Quick Knowledge Check ✅
Before you leave, rate your confidence (1-5) on each learning outcome on Ed Discussion:
- Defining key statistical terms ⭐⭐⭐⭐⭐
- Distinguishing sampling methods ⭐⭐⭐⭐⭐
- Identifying variable types ⭐⭐⭐⭐⭐
- Understanding research ethics ⭐⭐⭐⭐⭐
- Recognizing bias sources ⭐⭐⭐⭐⭐
If you rated anything 3 or below, please stay after class, I have office hours today! 🤝
Thank you for an engaging class!
📊✨
Questions? Office hours after class today.
![]()
STAT 17 – Spring 2026