Department of Statistics
Joint work with Luis Barboza, Shu Wei Chou, Hugo Hidalgo, and Eric Alfaro: Spatio-temporal downscaling emulator for regional climate models
Epilogue: Lessons learned on reproducibility
Assistant Professor of Teaching at the University of California SC
Applied statistician - transition from a purely research career to a teaching focused career, but continuing with applied projects.
My work on applied projects aims to develop a reproducible way to answer scientific questions with data. I use what I learn in this process to pass it on to my students when I design my courses.
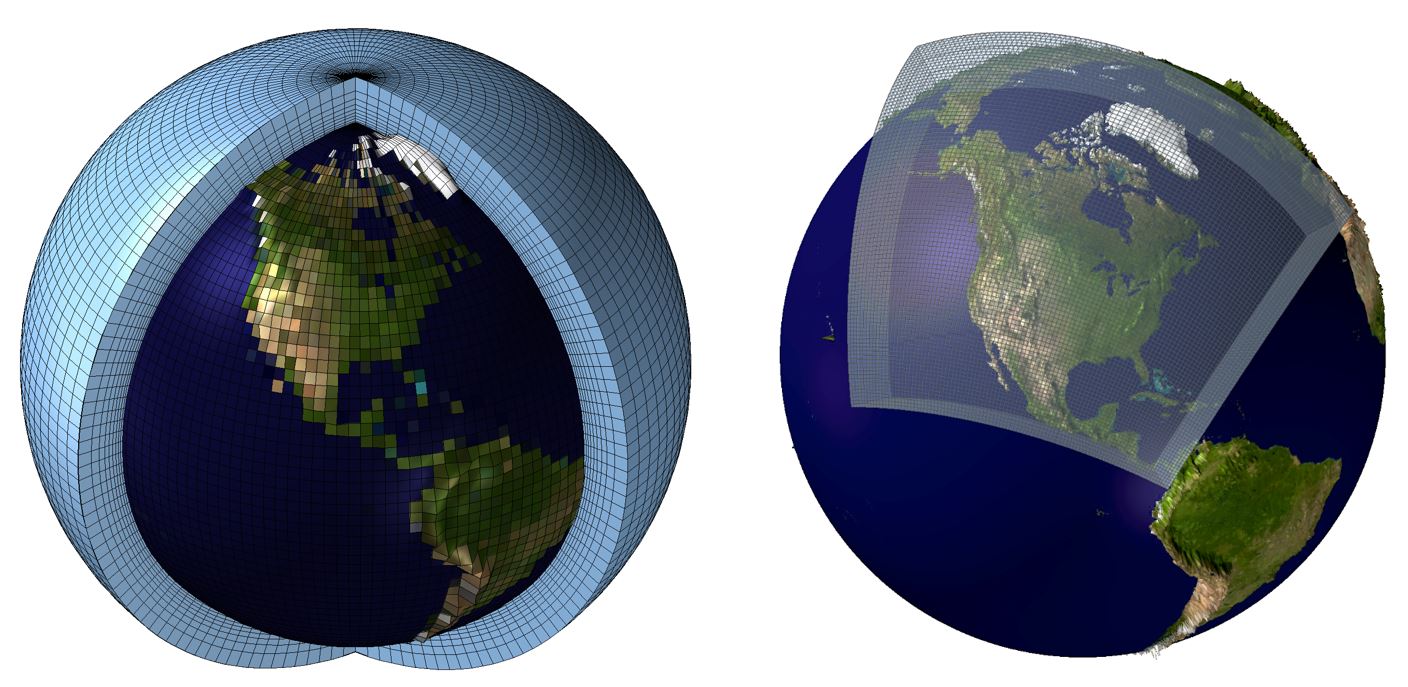
Downscaling is any procedure to infer high-resolution information from low-resolution variables. This technique is based on dynamical or statistical approaches.
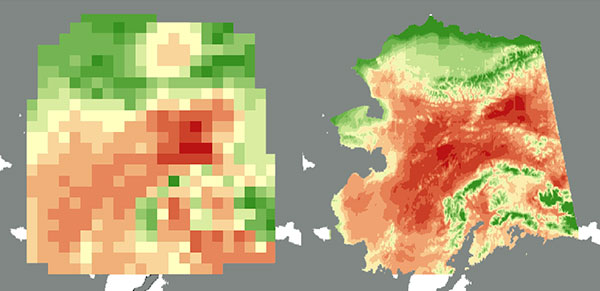
RCMs use atmospheric and oceanic climate output in general circulation models (GCM) to develop a higher resolution climate output.
They represent a tool for assessing climate variability and change impacts, to develop seasonal climate predictions, and are a powerful tool in general for improving our understanding of regional climate processes (Amador & Alfaro, 2009; Wang et al., 2004).

Source: https://narccap.ucar.edu/

Source: https://narccap.ucar.edu/
How can we develop a statistical downscaling emulator that can use output from a GCM to infer the values of a regional climate model?
Objectives:
Statistical emulators: Castruccio et al. (2014), Overstall and Woods (2016), Mearns et al. (1999), O’Hagan (2006) and Hernanz et al. (2022) have been used on climate models’ projections and on computer experiment output.
Spatio-temporal models as statistical emulators for storm surge models surge models (Hutchings et al., 2023), for modeling precipitation during tropical cyclones Kleiber et al. (2022) and to calibrate flood hazard models (Roth et al., 2022).
Other experiments to emulate regional models using downscaling techniques have been performed, as described in Wood et al. (2004) and Laflamme et al. (2016). However, they ignore the non-stationarity nature of the relationship between the GCM and RCM outputs.
This is the first attempt to emulate RCM using varying coefficient models - the family of models presented by Gelfand et al. (2003). We aim to provide a quantification of uncertainty in the downscaling process, and to provide a model that can be used to predict the values of the RCM using the GCM output.
\[\begin{align} C_t(s)=\alpha+\beta^\top X_t(s)+\epsilon_t(s), \label{eq-1} \end{align}\]
where:
\(C_t(s)\): climate-related variable represented as a random variable \(C_t(s)\) indexed by time \(t\) and spatial location \(s\in S\).
The spatial set \(S\) is assumed to be regularly-spaced with a fixed resolution.
\(q\) covariates linearly related with the dependent variable \(C_t(s)\)
\(\alpha\) and \(\beta\) are random parameters and \(\epsilon_t(s)\) is a white noise in both space and time with variance \(\zeta^2\).

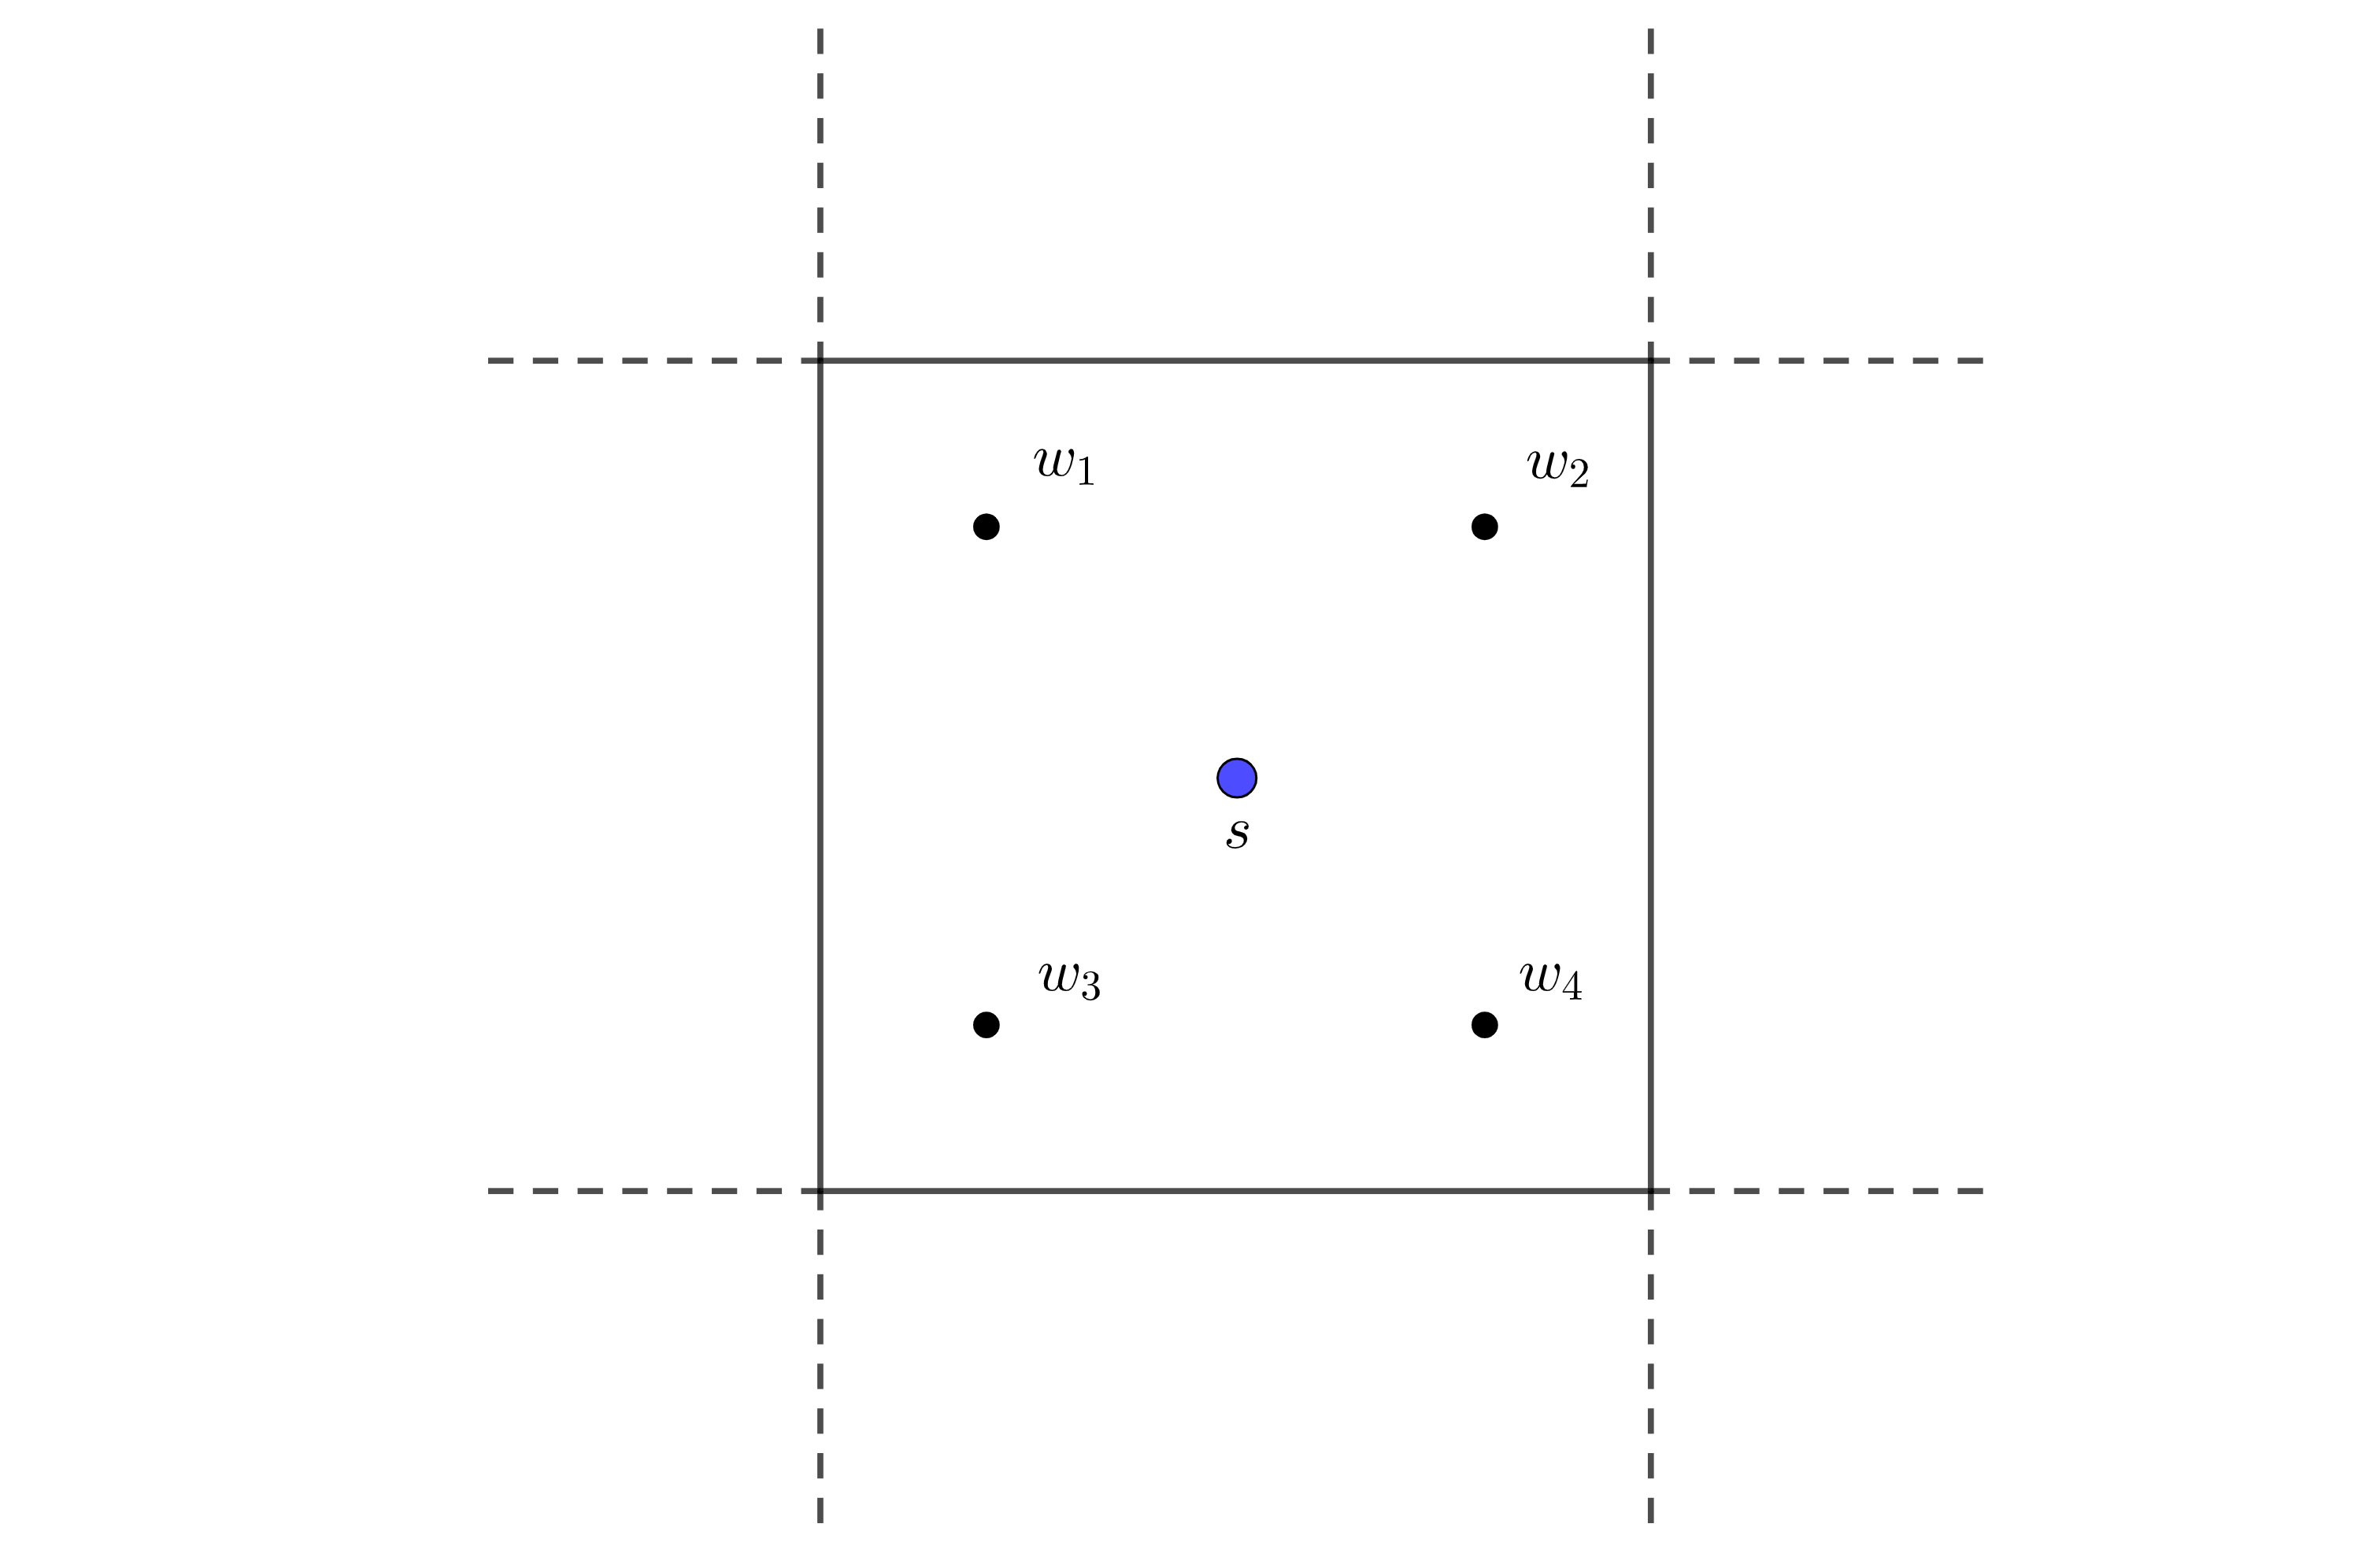
\[\begin{align} C_t(w)=[\alpha+\alpha_t^r(w)]+[\beta+\beta_t^r(w)]^\top X_t(s)+\epsilon_t(s)+\gamma_t(w), \end{align}\]
where
\[\begin{align} Y_t(w):=C_t(w)-C_t(s)=\alpha_t^r(w)+\beta_t^r(w)^\top X_t(s)+\gamma_t(w), \label{modelo} \end{align}\]
\(C_t(s)\) is treated as a known covariate in this model and hence we are interested in the modeling of the difference \(Y_t(w)\) in order to get predictions on the finer variable \(C_t(w)\).
\(\alpha_{\cdot}^r(\cdot)\) and \(\beta_{\cdot}^r(\cdot)\) represent random spatio-temporal correction terms on \(\alpha\) and \(\beta\) in the first equation due to the use of the predictor \(X_t(s)\) over the coarser set \(S\) and the change in scale between the sets \(S\) and \(W\).
Under a Bayesian approach, we are interested in the conditional distribution of the dependent vector \(\mathbf Y:=(Y_t(w))_{t,w}\) given the parameters \(\Phi:=(\beta_0,\beta_1,\theta_0,\theta_1, \tau^2)\): \[\begin{align*} \mathbf Y|\Phi \sim N(\beta_0+\mathbf X^\top \beta_1,\Sigma_Y), \end{align*}\] where \[\begin{align*} \Sigma_{\mathbf Y}=\mathbf X^\top \left(\Sigma_0(\theta_0)+\Sigma_1(\theta_1)\right) \mathbf X+\tau^2 I_n \end{align*}\] and \(\mathbf X\) is a block-diagonal matrix whose \(i\)-th sub-matrix is \(X^\top(s_i)\), \(i=1,\ldots,n\) and \(n\) is the number of locations in \(S\).
In order to evaluate the likelihood of \(\mathbf Y\) we need to evaluate the inverse and determinant of \(\Sigma_{\mathbf Y}\) which can be time-consuming for a combination of a large \(n\) and/or a large number of times \(t\).
We compare two estimation methods:
Integrated Nested Laplace Approximation (INLA)
The approach developed by Dambon et al. (2021) using the varycoef R package and adapting it to a Bayesian framework.
The INLA approach is applicable to a general specification for which the mean \(\eta_i\) of the observations \(y_i\) follows a linear structure: \[\begin{align}\label{eq:meanINLA} \eta_i = \alpha +\sum_{m=1}^M\beta_mx_{mi}+\sum_{l=1}^Lf_l(z_{li}), \end{align}\] where \(\alpha\) represents an intercept, the coefficients \(\mathbf{\beta} = (\beta_1,\ldots,\beta_M)\) relate \(M\) covariates \((x_1,\ldots,x_M)\) to \(\eta_i\), and \(f = \{f_1(\cdot),\ldots,f_L(\cdot)\}\) is a collection of random effects defined on a set of \(L\) covariates \((z_1,\ldots,z_L)\) (Rue 2009 and Blangiardo 2013).
Let \(y_i=\eta_i=Y_t(w)\) and the varying intercept and slope are the latent variables with fixed effects as their respective means \(\beta_0\) and \(\beta_1\), then our models fall into the general specification of INLA.
INLA assumes that the prior of vector \(\Phi\) is a multivariate normal random vector with a precision matrix that depends on a certain set of hyperparameters.
INLA further approximates the conditional distribution of \(\Phi\) by using a simplified Laplace Approximation together with optimization procedures (Rue 2009).
This approach has two important assumptions:
\[\begin{align} \Sigma_Y=\sum_{i=1}^p \Sigma^{j} \odot \mathbf X^{j}+\tau^2 I_n, \end{align}\]
where \(\odot\) is the Hadamard product and \(\mathbf X^{j}:= x^{(j)}\left(x^{(j)}\right)^\top\) uses the \(j\)th covariate \(x^{(j)}\).
The covariance matrix can be simplified as:
\[\begin{align} \Sigma_{Y,tap}=\sum_{i=1}^p \Sigma_{tap}^{j} \odot \mathbf X^{j}+\tau^2 I_n. \end{align}\]
The tapering, together with the sparsity of the matrix \(\textbf{X}\) reduces the execution time. This approach is fully implemented with maximum likelihood estimation using the R package varycoef, available on CRAN. We adapted the approach by using MCMC estimation.
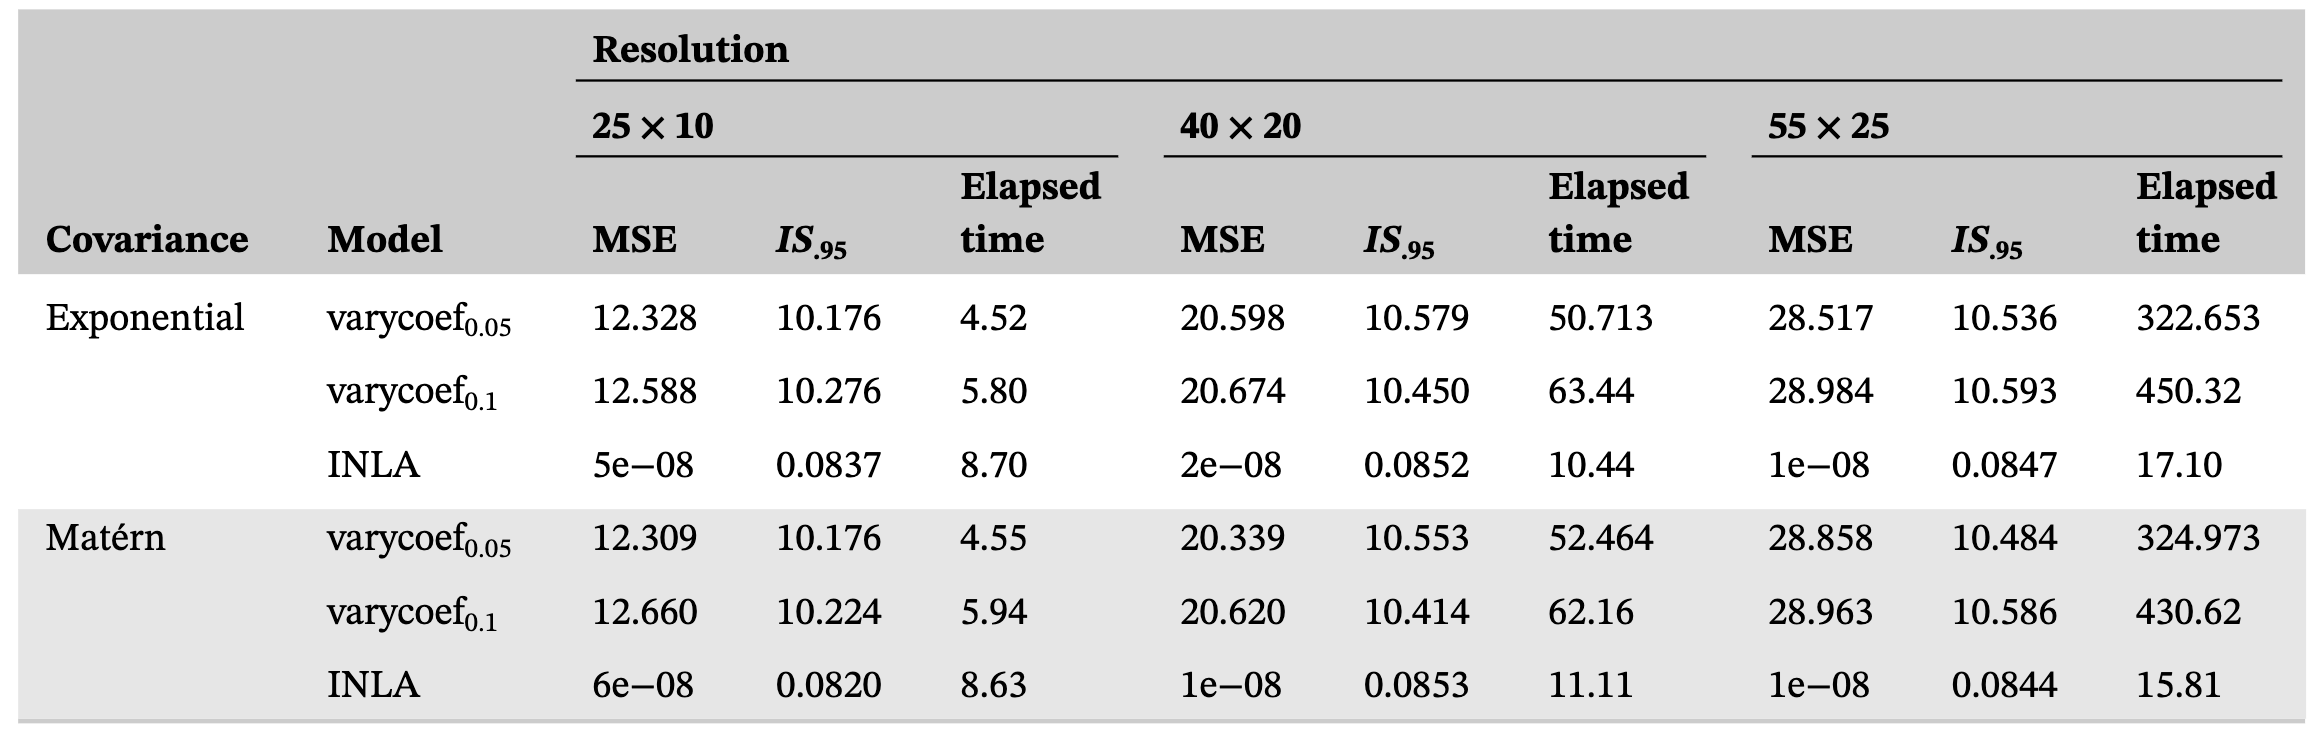
First. Comparing the performance of the INLA and Dambon et al. (2021) approaches in terms of predictive capacity and computational time.
Second study. Evaluating the performance of the proposed emulator in terms of predictive capacity and computational time, using the best estimation method from the first study.
Statistics used to evaluate the performance of the emulator:
\[\begin{align} \mathit{IS}_{\alpha}=\frac 1 n \sum_{t,w}\left[(U_t(w)-L_t(w))+\frac{2}{1-\alpha}(L_t(w)-Y_t(w))\cdot 1_{Y_t(w)<L_t(w)}\right. \\ \left.+\frac{2}{1-\alpha}(Y_t(w)-U_t(w))\cdot 1_{Y_t(w)>U_t(w)}\right], \end{align}\]
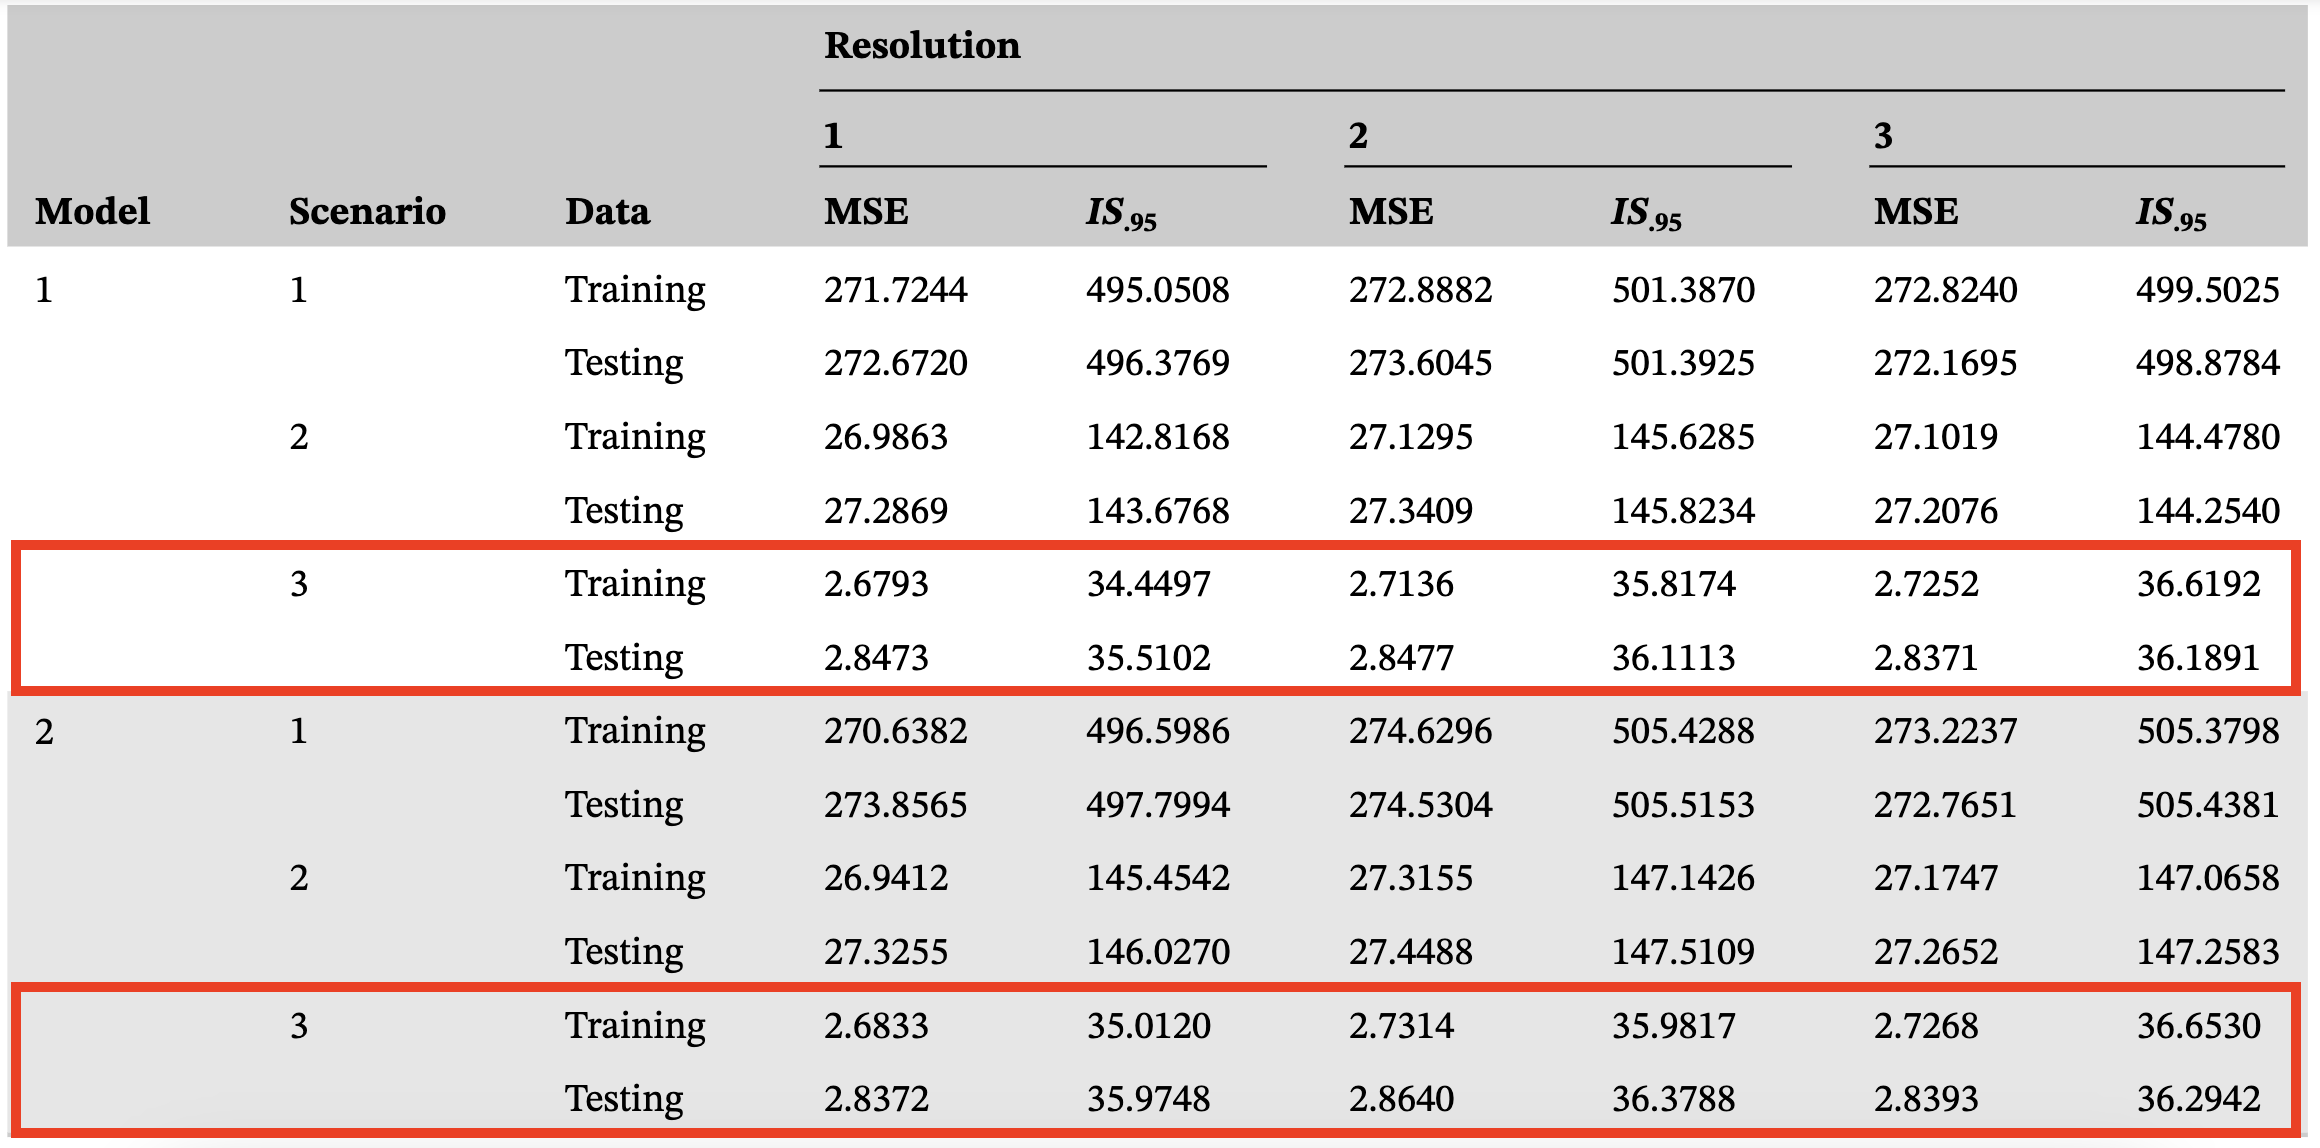
In the spatial region \(\left[0,1\right]^2\), we set three different resolutions for the regularly-spaced set \(S\) and the finer set \(W\). We use \(25 \times 10\), \(40 \times 20\) and \(55 \times 25\) as three different resolution scenarios for this simulation and for each scenario we generate 10 replications.
At these locations, we simulate two models fixing \(q=1\), \(\alpha=5.6\), \(\beta_0=-0.05\), \(\beta=0.015\), \(\beta_1=-0.005\), \(\zeta^2=2\) and \(\tau^2=1\).
We consider a spatially varying intercept with a spatial covariance structure following either a Matérn \((\phi=0.1,\sigma=0.001,\nu=0.8)\) or an Exponential\((\phi=0.1,\sigma=0.001)\).
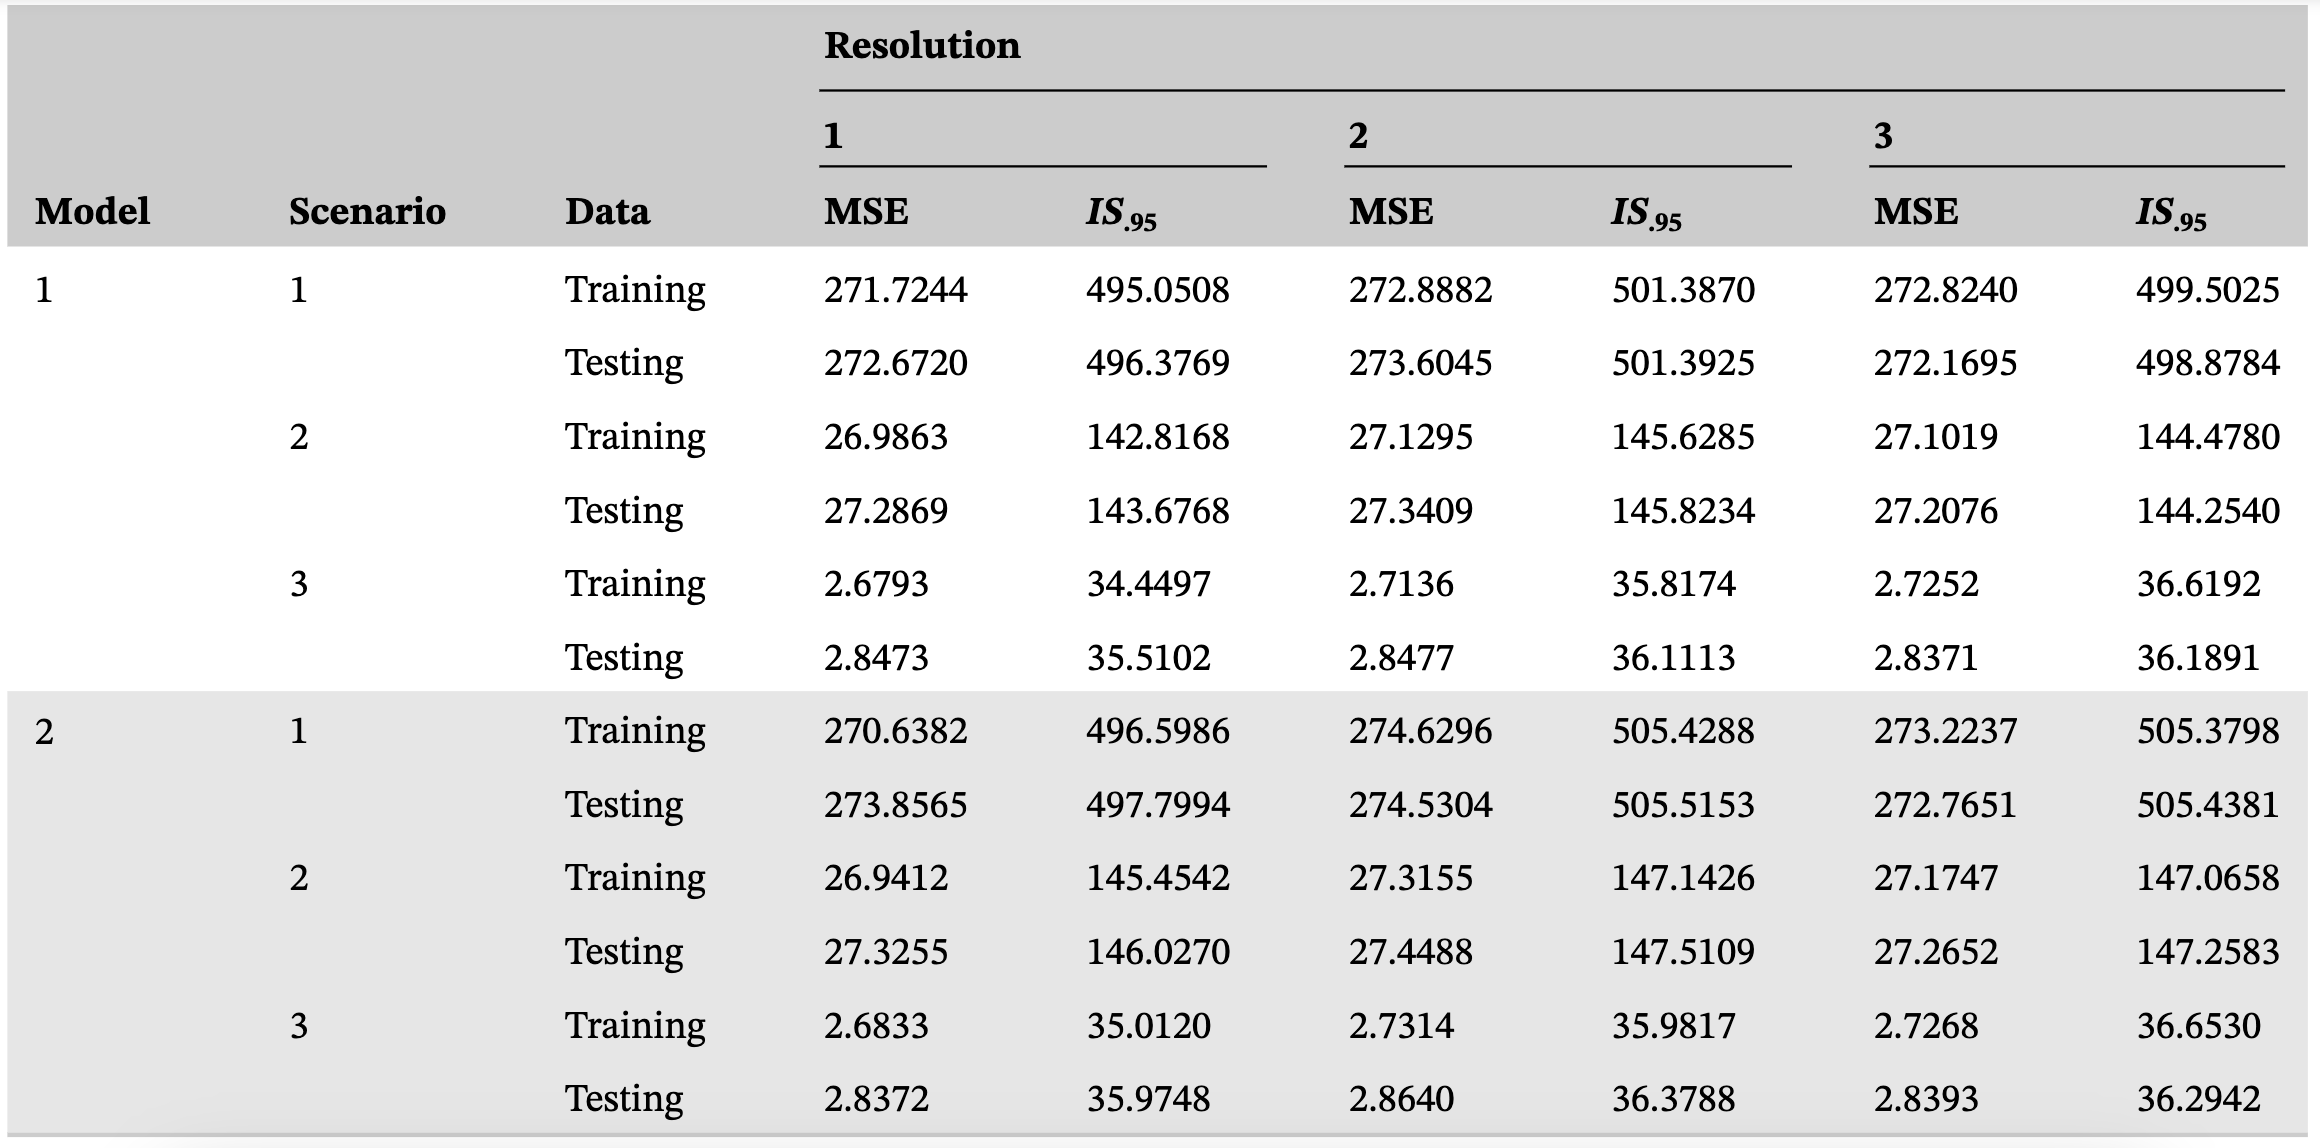
In the spatial region \(\left[0,20\right]^2\), we set three different resolutions for the regularly-spaced set \(S\) and the finer set \(W\). We use \((20 \times 10)\) as Resolution 1, \((40 \times 20)\) as Resolution 2, and \((60 \times 10)\) as Resolution 3.
\(T=12\) periods of time were simulated for each scenario. For each simulated data, we divided it into two sets: a training data set containing the first \(5/6\) periods of time, and a testing data set, containing the last \(1/6\) periods of time.
The INLA method outperformed the Dambon approach in terms of predictive capacity and computational time for fitting the proposed emulator model.
The emulator showed potential for accurately predicting RCM output using GCM output, with good out-of-sample predictive performance.
The elapsed time for the emulator was around 1 min for all scenarios, which is a reasonable time for a model with a large number of parameters.
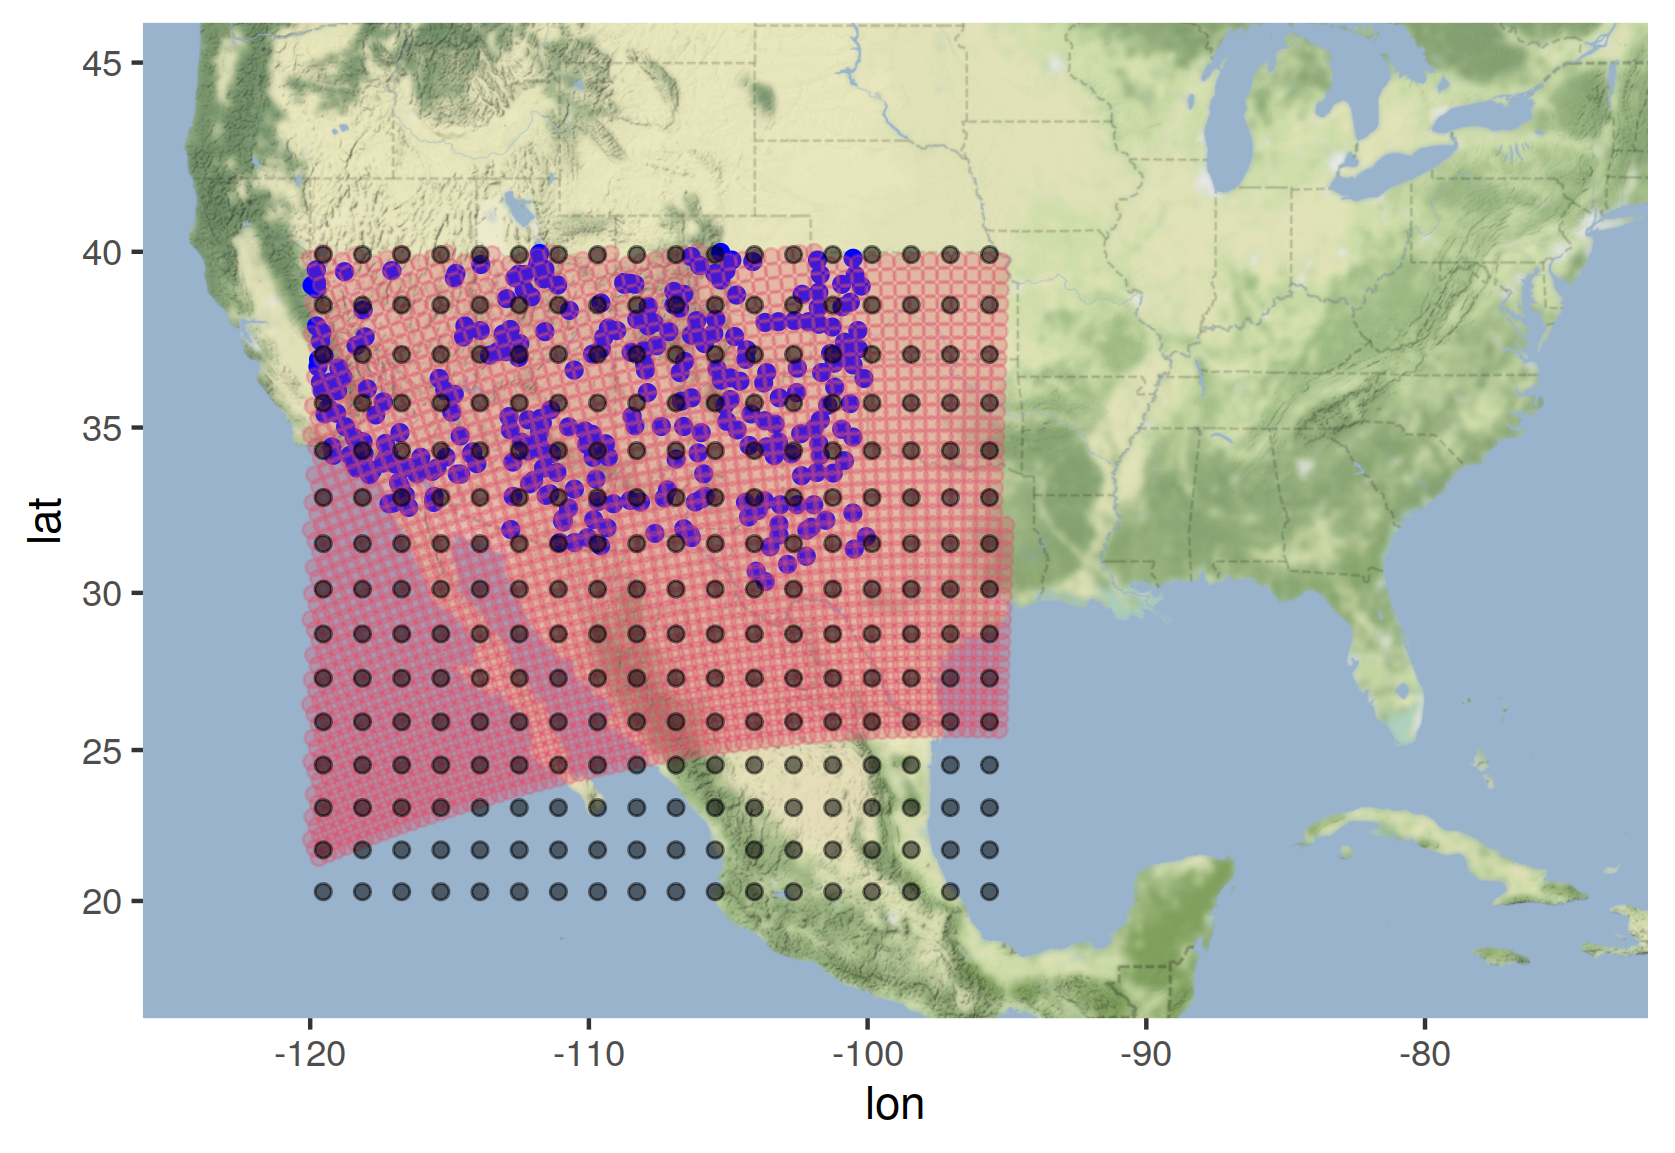
Coordinates for the Canadian Regional Climate Model (CRCM) (red points), the Community Climate System Model (CCSM) in the North American Region (black points) and observed temperatures (blue points).
Mean air surface temperature (ts) measured in Kelvin from the Canadian Regional Climate Model (CRCM) (Caya et al., 1995),
Seasonal mean pressure vertical velocity measured in Pa/s (OMEGA) and mean air surface temperature (TREFHT) measured in Kelvin from Community Climate System Model (CCSM) (Mearns et al., 2007).
2482 points in the regional-model resolution grid, and 270 points for the global-based one. Monthly data from 1990 to 1998 (inclusive) was used to fit the model
180 observed surface air temperature records from the National Climatic Data Center (NCDC) (Groisman et al. (2004) and Alfaro et al. (2006)) to test the results.
The main objective of the emulator is to use the CCSM output to infer the values of the CRCM output.
There is a non-stationary relationship between the CCSM output and the regional model response.
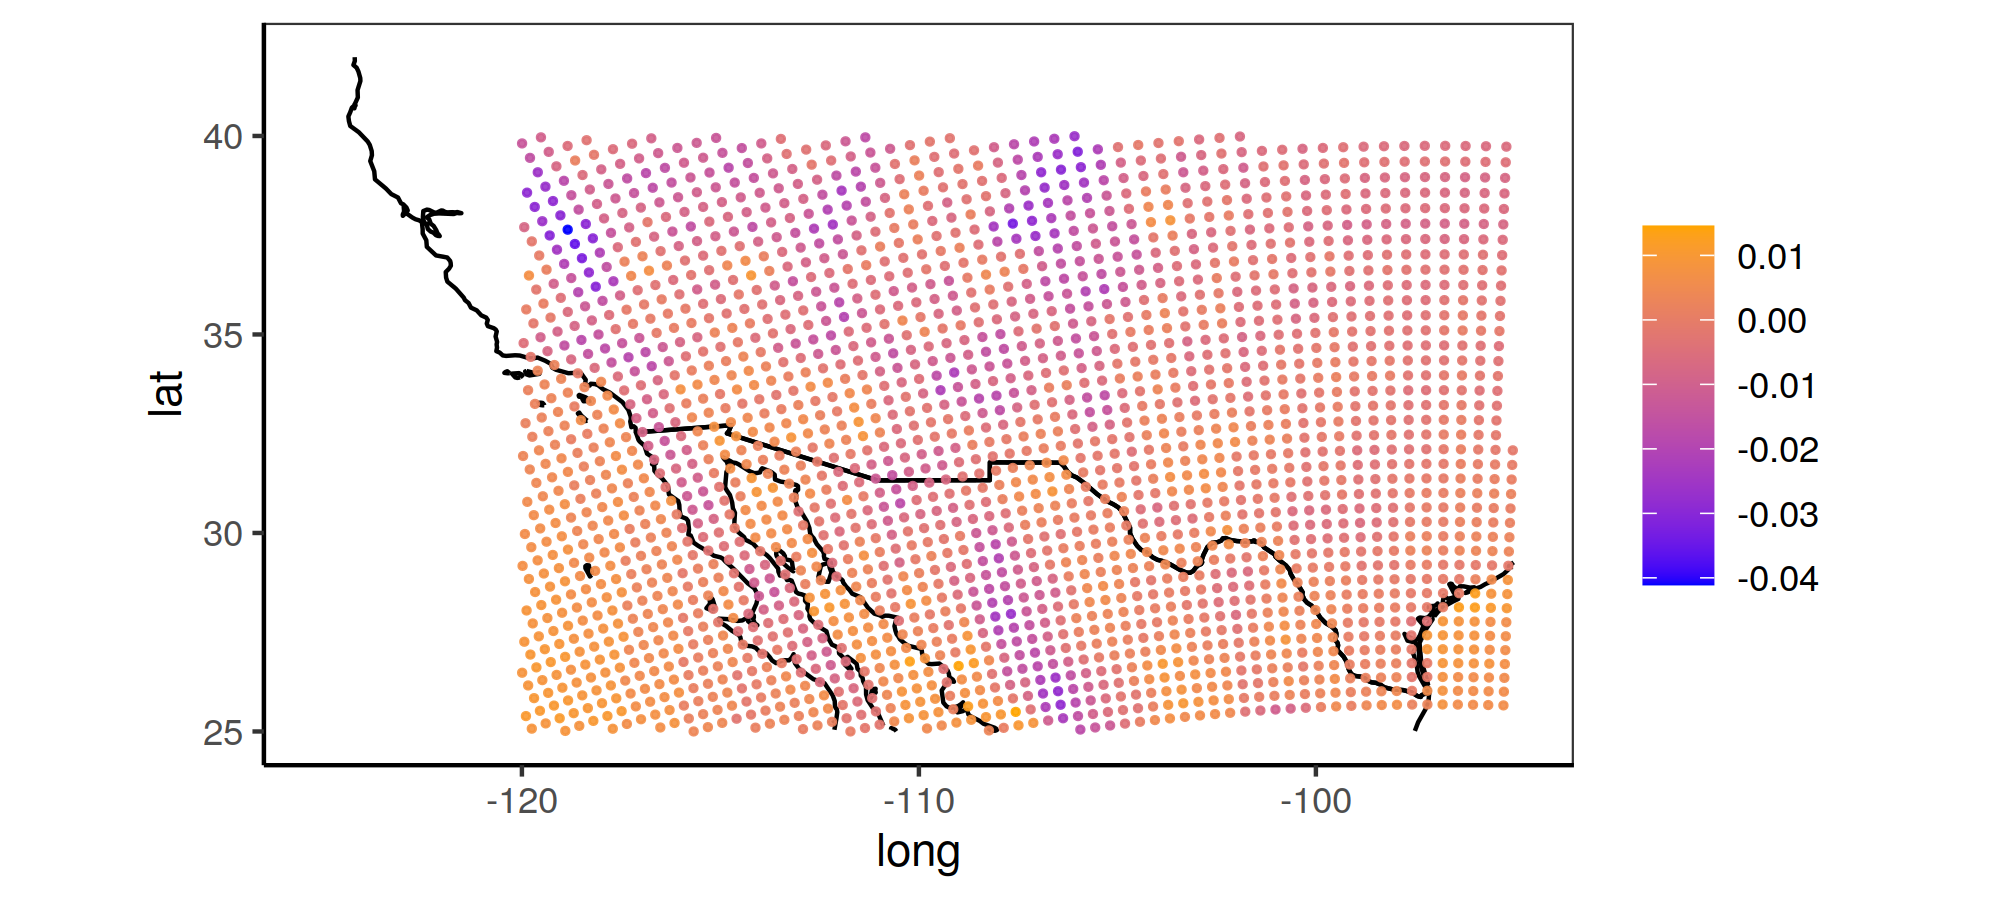
Mean difference between the monthly temperature log-outputs among the regional and global models (1990-1999)
\[\begin{align} Y_t(w):=C_t(w)-C_t(s)=\alpha_t^r(w)+\beta_t^r(w)^\top X_t(s)+\gamma_t(w), \end{align}\]
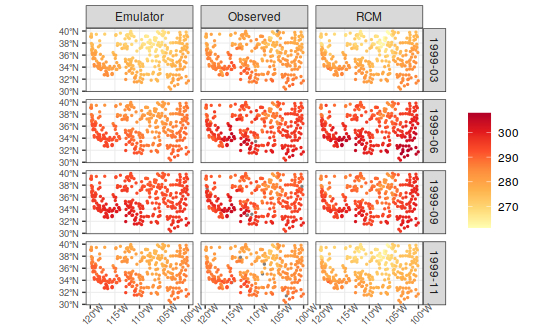
Estimated temperatures according to Model 1 (emulator), observed temperatures and RCM.
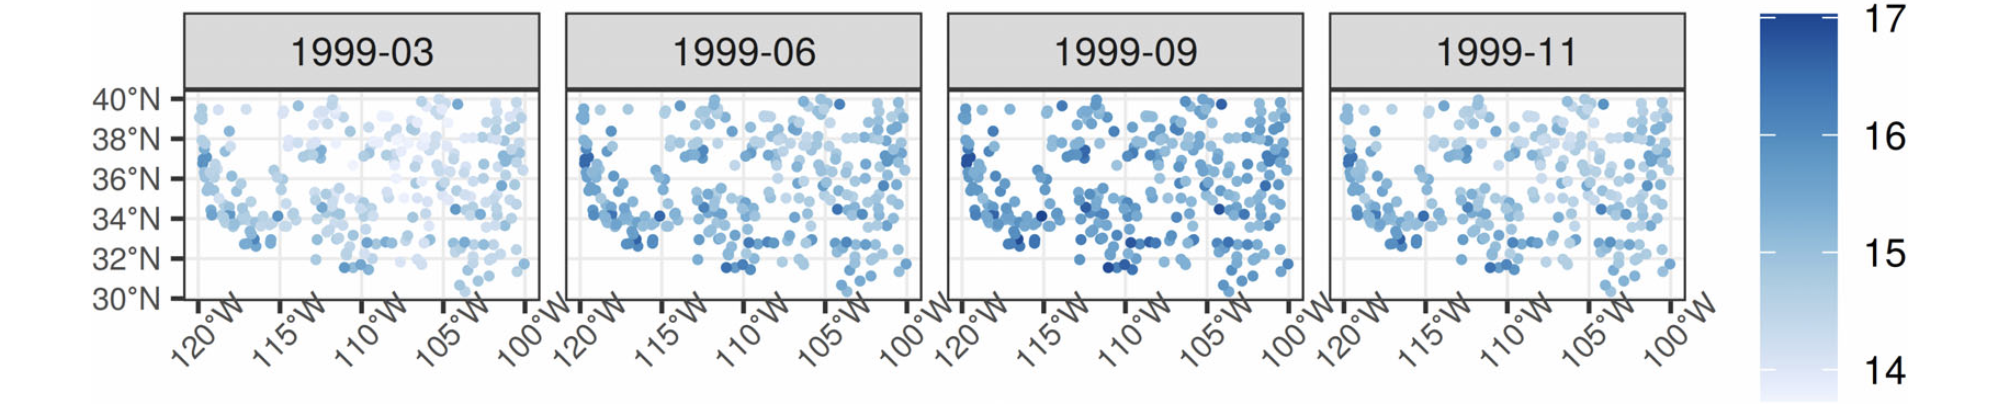
Interquartile range for four chosen months during the testing period. Missing values are drawn in gray.
A spatio-temporal downscaling emulator for regional models was proposed using spatial varying coefficients. The model can estimate non-stationary marginal effects, which means that the downscaling function can vary over space.
INLA was the best method to estimate the spatial and spatial temporal versions of the proposed model, when compared with the Dambon et al. (2021) approach, under different tapering coefficients.
The model has good prediction results for reproducing the annual cycles for one particular year, as shown on both the simulation results, and the analysis of NARCCAP data. These good results in terms of prediction happens in spite of the possible identification issues observed in the same sections.
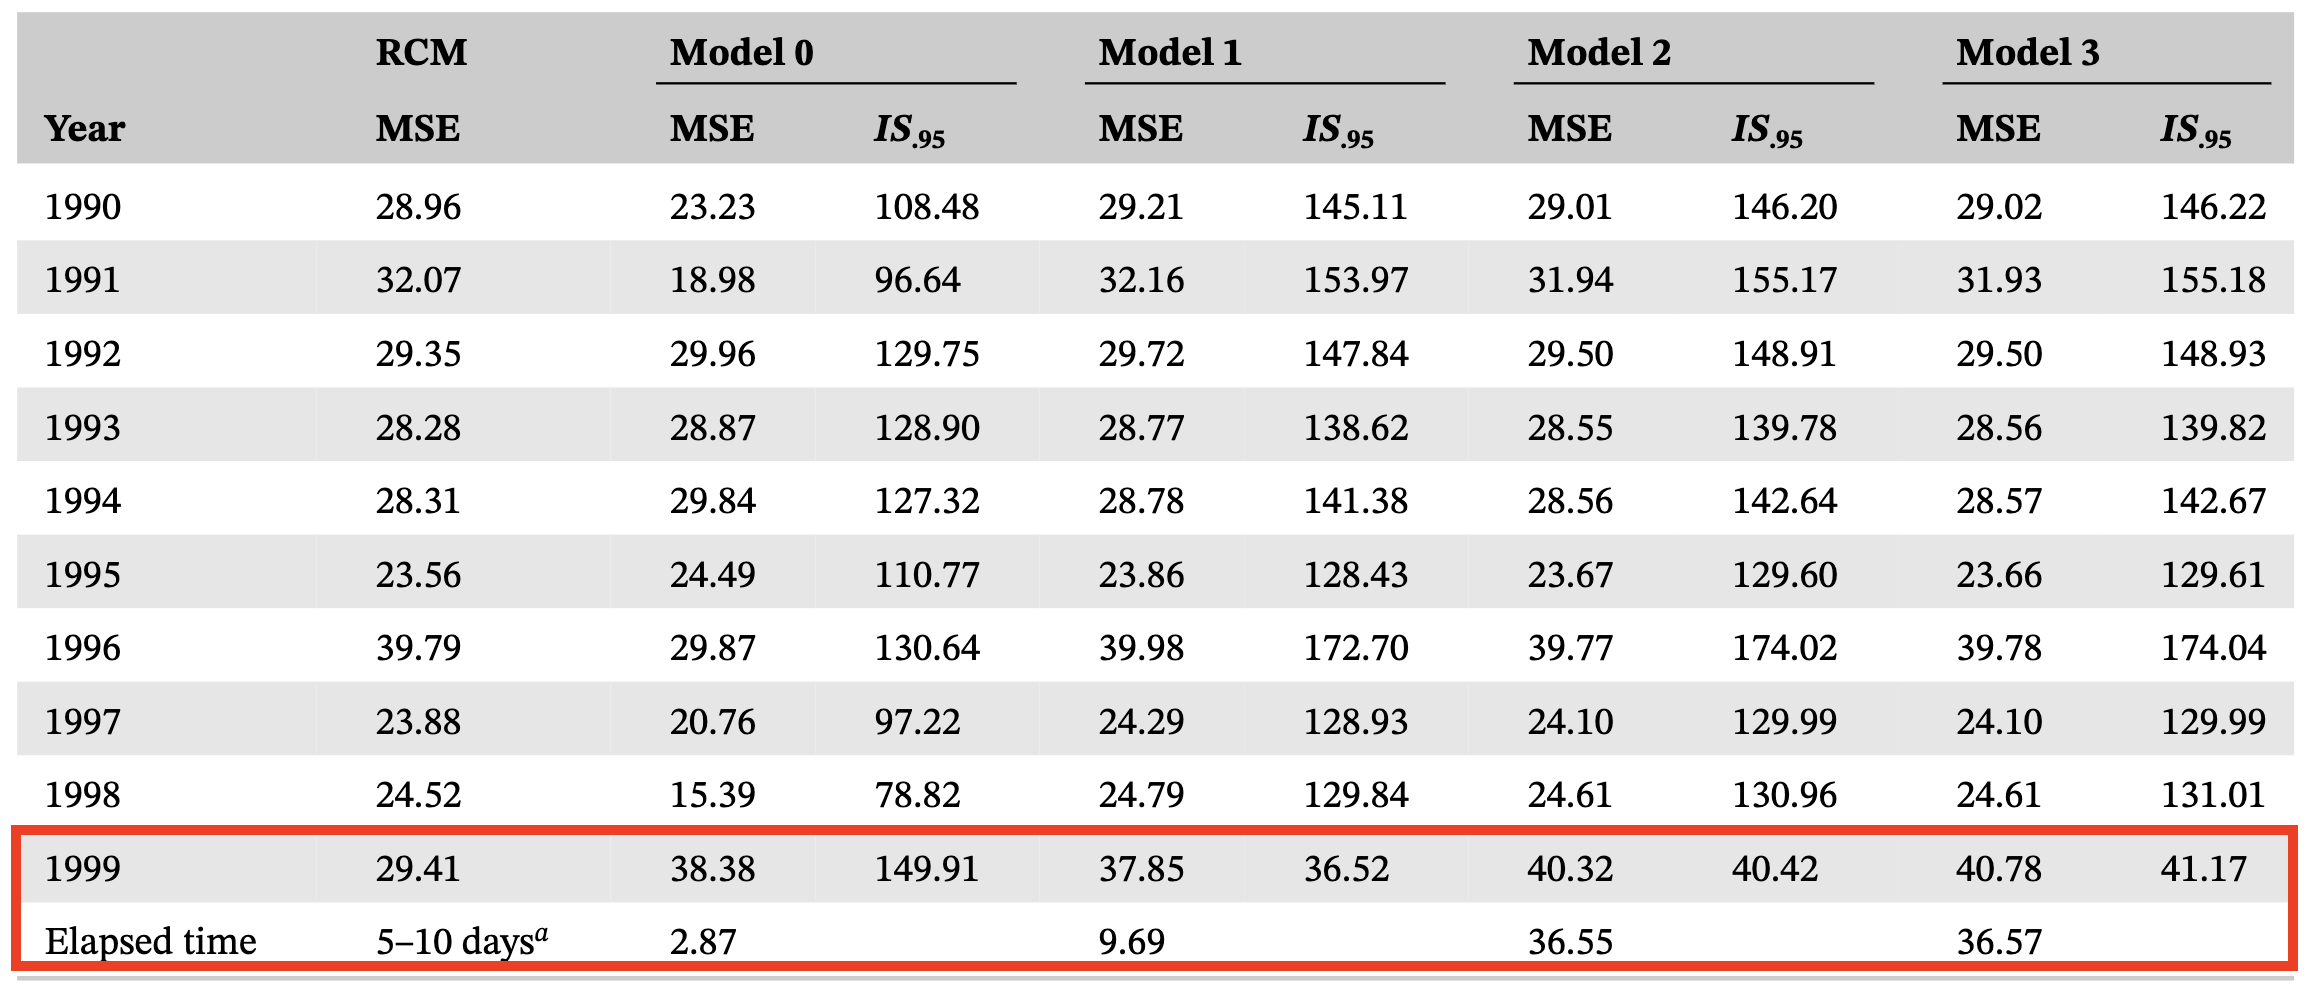
The downscaling emulator showed potential for predicting accurately output from RCM using the output from a GCM. Specifically, temperature from the CRCM can be predicted using mean pressure vertical velocity output from CCSM with an out of sample MSE of approximately 34 units for all models proposed, and with a \(95\%\) IS that is significantly lower for Models 2 and 3, compared to the other options.
Furthermore, when adding the elapsed time to run the models, and given that Model 1 and Model 2 give very similar predictive performance results, then Model 1 is preferred, since it can be run in less than one third of the time that takes to complete Model 2.
HP Proliant DL380 Gen9 server, Intel(R) Xeon(R) CPU E5-2630 v3 @ 2.40GHz, with16 logical cores, and 128GB RAM.
The R scripts to read and wrangle the NARCCAP data, as well to run all of the models described in this article are available at https://github.com/LEA-UCR/MRA-ST and were run using RStudio Server2022.02.2 Build 485. Packages and R version are specified in the Readme repository file.
The importance of reproducibility in scientific research is well known, but it is not always easy to achieve.
JASA Reproducible Research Recommendations (2017)
Questions?
Article (with references): https://onlinelibrary.wiley.com/doi/epdf/10.1002/env.2815
Reproducible analysis references:
Alston et al (2021) A Beginner’s Guide to Conducting Reproducible Research https://esajournals.onlinelibrary.wiley.com/doi/full/10.1002/bes2.1801
Broman et al (2017) Recommendations to Funding Agencies for Supporting Reproducible Research https://www.amstat.org/asa/files/pdfs/POL-ReproducibleResearchRecommendations.pdf
JASA Reproducibility Guide https://jasa-acs.github.io/repro-guide/pages/acc.html