Linear Regression in Practice
Week 5 · Tuesday, Oct 27 · Lecture + AI audit #1
Today’s plan
| Time | What |
|---|---|
| 1:30 | DS 5 check: swap laptops |
| 1:45 | Fitting a line: lm(), slope, intercept, prediction |
| 2:10 | How good is the line? summary() and residuals |
| 2:25 | AI audit #1, in groups |
| 2:55 | Your project’s first model |
Learning goals: fit and plot a one-predictor linear model, read its slope, R² and p-value in the units of the data, and check the residuals before believing any of it.
DS 5 check
Swap laptops
⏱ 10 min
Swap laptops with your neighbor. On their laptop, open week05/ds05_notes.R:
- Restart test: Session → Restart R, then source the script. Does it run with no errors?
- Break a function: call their
knots_to_kmh()with"fast"and with-3. Does it stop, with a clear message? - Compare one exercise with yours. Different numbers are expected. Is the code doing the same thing?
- Read their two comments at the bottom. Can you help with either one?
At the top of their script, add: # Checked by <your name>: one thing that works, one question
Then, back on your own laptop
On the Ed thread “DS 5 check”, post two lines:
- The hardest part to understand this week
- Something that hasn’t quite clicked yet
Note
This is today’s 1-point discussion check: a careful swap, a comment left in your classmate’s script, and your Ed post. I read every post, and they decide what we review next week.
Fitting a line
A question worth a line
Do people in richer countries live longer? One year, 142 countries:
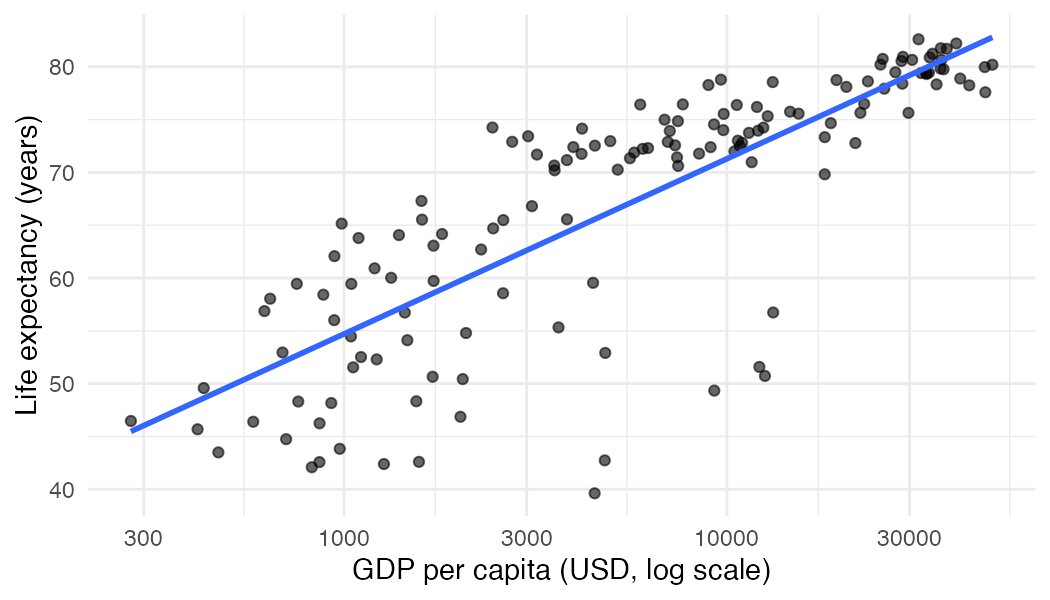
Week 4’s plot. Today: the numbers behind that blue line.
lm(): a linear model
| Piece | Means |
|---|---|
lifeExp ~ log10(gdpPercap) |
“life expectancy explained by log GDP”: response on the left of ~ |
data = gm07 |
where to find those columns |
fit |
a model object: estimates, fitted values, residuals, all inside |
Why log10()? Week 4: on a log scale the cloud is a straight line. On the raw scale it isn’t, and a straight line won’t fit it. Hold that thought until the audit.
Read the slope in the units of the data
Slope, 16.6: one step on log10(gdpPercap) is a ten-fold increase in GDP per capita. So:
Countries with ten times the income have, on average, a predicted life expectancy 16.6 years higher.
Intercept, 4.95: the prediction when log10(gdpPercap) is 0, at $1 per person. No country is near that (the poorest is about $278). It positions the line; it means nothing on its own.
Predictions
predict()does the arithmetic, and applies thelog10()for younewdatamust have a column with the same name as the predictor in the formula
Warning
Predict only inside the range of your data: here, about $278 to $49,357. Outside it, the line is a guess with decimals.
Your turn: two predictions
⏱ 5 min
In a new script, week05/regression.R:
- Fit
fit, as above - Predict life expectancy at $1,000 and at $10,000, with one call to
predict() - Subtract the two predictions. Where have you seen that number before?
How good is the line?
summary(): read three numbers
| Number | Here | What it says |
|---|---|---|
| Estimate | 16.585 | the slope, same as coef() |
Pr(>|t|) for the slope |
< 2e-16 | a slope this far from 0 would be very unlikely if there were no linear relationship |
| R² | 0.654 | the line accounts for 65% of the variation in life expectancy |
A small p-value says the slope isn’t zero. It says nothing about how big, how important, or how causal the relationship is.
Residuals: what the line misses
gm07$resid <- residuals(fit)       # observed minus predicted
head(gm07[order(gm07$resid), c("country", "lifeExp", "gdpPercap", "resid")], 4)
#>           country lifeExp gdpPercap     resid
#> 1464    Swaziland  39.613  4513.481 -25.94692
#> 48         Angola  42.731  4797.231 -23.26808
#> 168      Botswana  50.728 12569.852 -22.20926
#> 1416 South Africa  49.339  9269.658 -21.40462
Swaziland (now Eswatini) lives about 26 years shorter than its income predicts. Southern Africa in 2007 was at the height of the HIV/AIDS epidemic. The biggest residuals are often the most interesting part of an analysis.
The residual plot
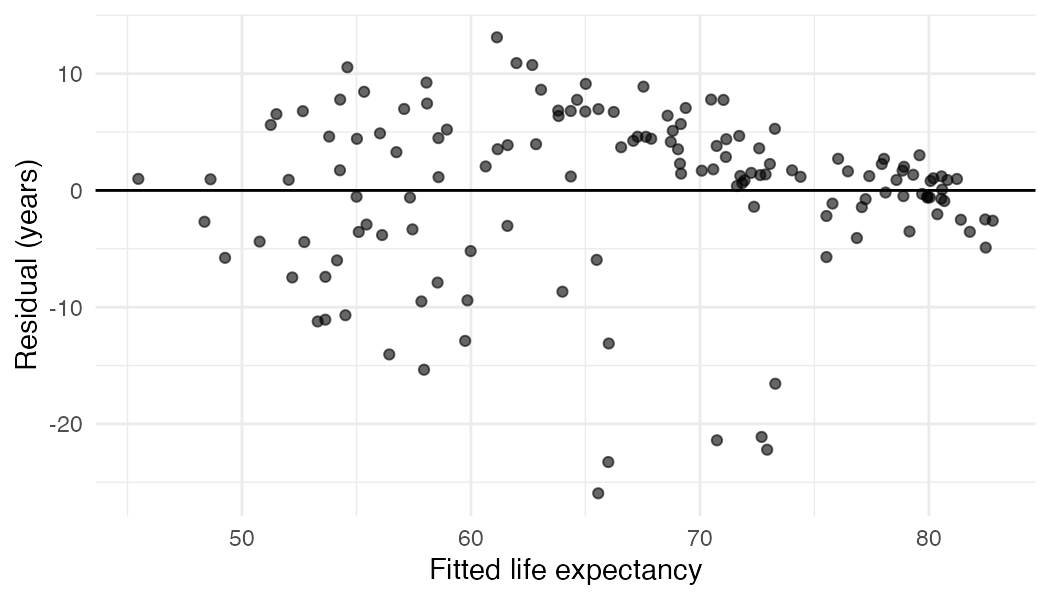
What you hope for: a shapeless cloud around 0. A curve means the straight line is missing something; a funnel means the spread changes. Here: mostly a cloud, with a long tail of countries far below the line.
Check how many rows the model used
The survey: do people who live farther away visit the library less?
- 44, not 45:
lm()quietly dropped the row with a missing commute (id 35). You knew about it from Week 3. Did you knowlm()would drop it? - Slope ≈ 0, R² ≈ 0, p = 0.96: no linear relationship in these data. That’s a result too
Tip
After every lm(): nobs(fit). If the number surprises you, go back to your cleaning script.
A line is not a cause
“Associated with”, not “causes”, “increases” or “leads to”.
- Income, health systems, education, history and conflict are all tangled together
- The model can’t tell you that raising a country’s GDP will raise its life expectancy
- It describes these data: 142 countries, 2007
This is the sentence AI tools get wrong most often. Which brings us to the audit.
AI audit #1
The task
⏱ 15 min
In groups of 3. The next slide is a regression analysis written by an AI, for the same question and data we just used. It runs without errors.
- Find everything that is wrong or misleading. There are at least five problems
- For each: what’s wrong, how you found it, and the corrected sentence or code
- Run the code if it helps. You may not ask another AI
Then 10 minutes together. Each group reports one problem, and how they found it. The “how” is the skill.
The AI’s analysis
Results. GDP per capita has a highly significant positive effect on life expectancy (p < 0.001). The intercept shows that the average life expectancy in 2007 was 59.6 years. Each additional $10,000 of GDP per capita increases life expectancy by 6.4 years. The model is 46% accurate (R² = 0.46). A country with a GDP per capita of $100,000 would have a life expectancy of 123 years.
Conclusion. Because the p-value is so small, GDP is the most important factor determining life expectancy. Countries should prioritize economic growth to improve health.
What we found: the numbers
| AI says | Problem | How you’d find it |
|---|---|---|
| (no plot) a straight line on raw GDP | Unchecked assumption. The relationship is curved | Plot it; residual plot shows a clear curve. With log10(): R² 0.65 vs 0.46 |
| “average life expectancy was 59.6” | Misread intercept. It’s the prediction at \(0 | `mean(gm07\)lifeExp)is 67.0 | | "46% accurate" | **Misread R².** It's the share of variation explained | Lesson 11, or?summary.lm` |
What we found: the conclusions
| AI says | Problem | How you’d find it |
|---|---|---|
| “$100,000 → 123 years” | Extrapolation. The data stop at \(49,357 | `range(gm07\)gdpPercap)`; nobody lives 123 years | |
| “increases”, “should prioritize growth” | Causal claim from observational data | Ask: what else differs between rich and poor countries? |
| “most important factor” | p-value misread as importance | A p-value is not a size; there’s only one predictor to compare |
The plot the AI never made
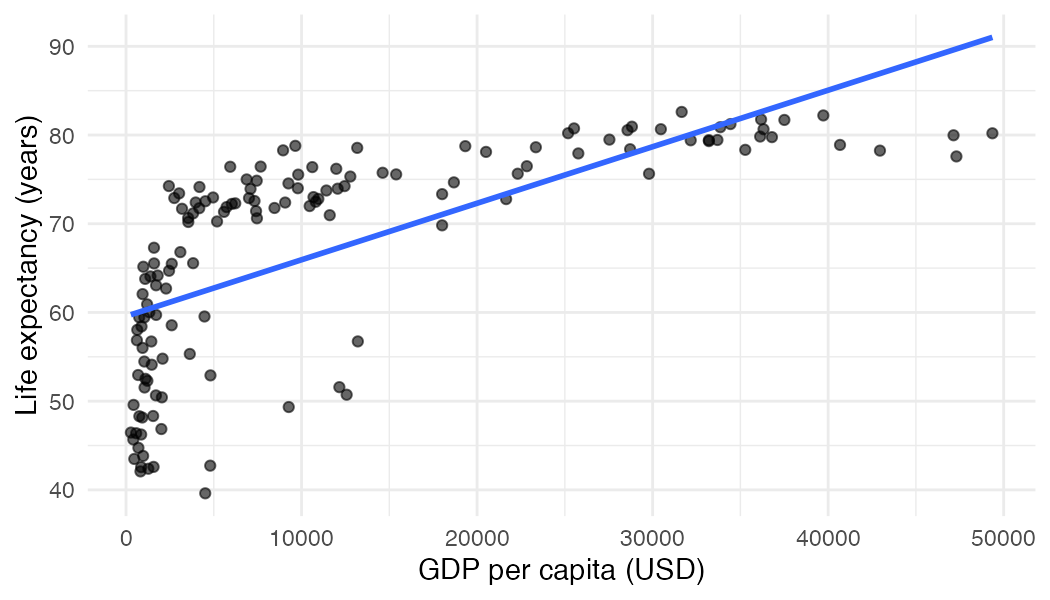
The straight line on the raw scale: too high for the poorest and richest countries, too low in the middle.
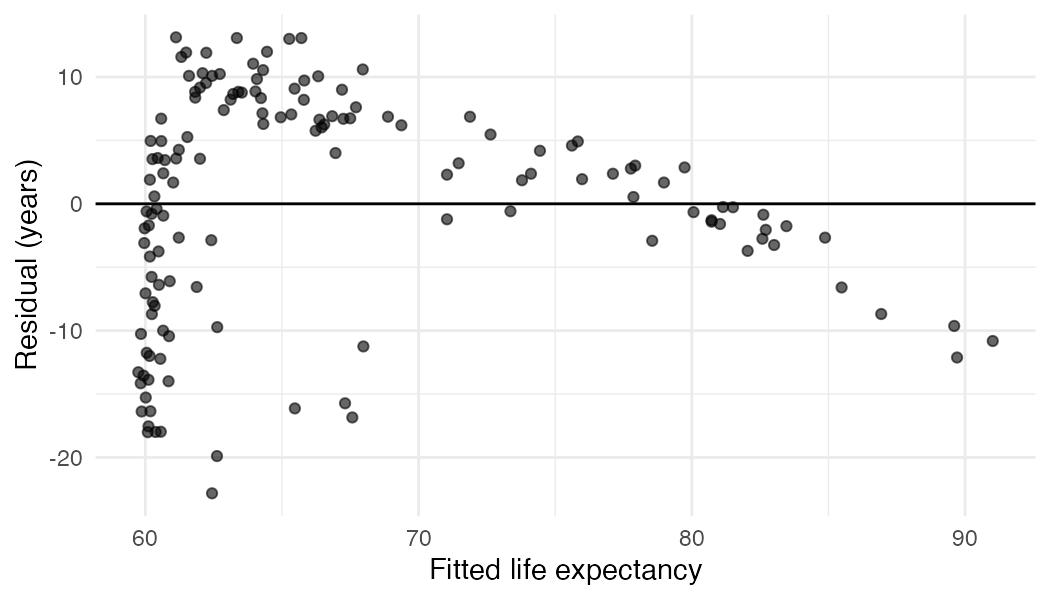
Its residuals: a clear arch, not a cloud. Compare with the residual plot of the log model.
Post your audit
On the Ed thread “AI audit #1”, one post per group:
- The problem your group found first, and how
- The one you missed, and what would have helped you catch it
Important
The habit: before believing any regression, from an AI, a paper, or yourself: plot the data, plot the residuals, check nobs(), and read every coefficient in its units.
Your project’s first model
For the mid-quarter report
Due Tue, Nov 3: data cleaned by a script, first figures, first model. Start now:
- Write the question as “y explained by x”. What’s one row?
- Plot y against x. Straight? Does a log help?
fit <- lm(y ~ x, data = ...), thennobs(fit)- One sentence for the slope, in units: “for each …, predicted … is … higher”
- The residual plot. Which observations are furthest from the line, and why?
AI is allowed on the report, with disclosure. After today, you know what to check in anything it writes.
Key points
lm(y ~ x, data = df)fits a straight line;coef(),predict(),residuals(),nobs()get its pieces- With
log10(x)as predictor, the slope is the change in y per ten-fold increase in x - The intercept is the prediction at x = 0, often outside the data and meaningless alone
- R² is the share of variation explained, not accuracy. A small p-value says the slope isn’t zero, not that it matters
- Plot the data and the residuals before believing the numbers. Predict only inside the data
- Regression describes association, not cause
Before Thursday
Practice: Lesson 11: Regression in Practice covers everything from today, with your own year of data.
Thursday, Oct 29: Writing Data, Splitting and Combining Data Frames.

STAT 266A · Fall 2026 · UC Santa Cruz